

Prior TSOH Quarterly Updates:
Q2 ’21, Q3 ’21, Q4 ’21, Q1 ‘22, Q2 ‘22, Q3 ‘22, Q4 ‘22, Q1 ‘23, Q2 ‘23, Q3 ‘23, Q4 ‘23, Q1 ‘24, Q2 ‘24, Q3 ‘24, Q4 ‘24, Q1 ‘25, Q2 ‘25, Q3 ‘25, Q4 ‘25, Q1 ‘26, Q2 ‘26
Q3 2026 Portfolio Changes:
Q3 2026 Top TSOH Research:
“On Holdings: Maintaining Pace” (07/20/26)
“Peloton: Subscriber Squeeze” (08/10/26)
“Portillo’s: Strategic Reset” (08/24/26)
“Celsius: The Pepsi Put” (09/07/26)
This chart seems a fitting summary of the current market environment.
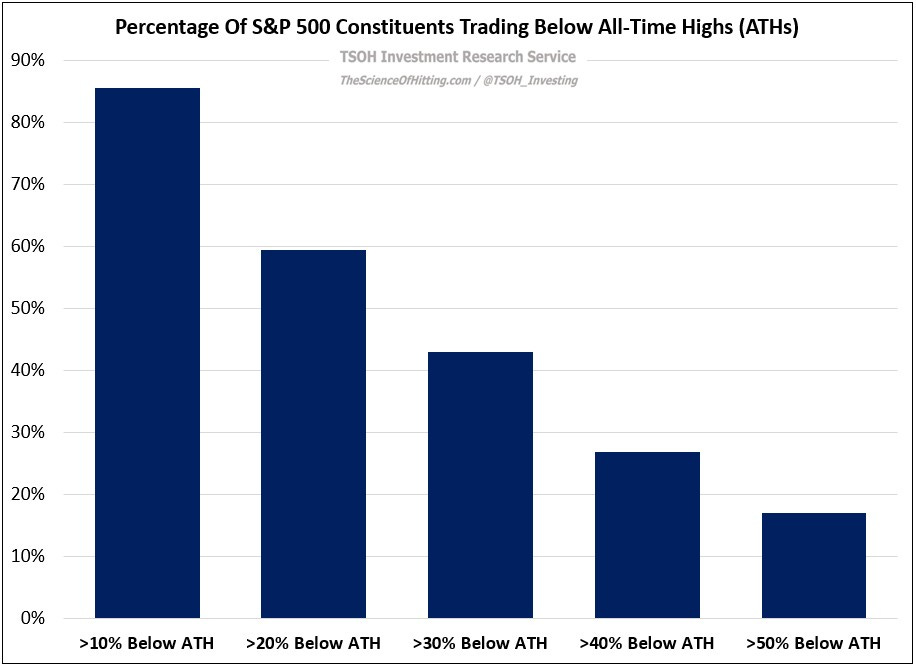
Despite the S&P 500 being up low double digits YTD, and trading just shy of its all-time high (ATH), the majority of its constituents are trading >20% below their ATHs, with more than one-quarter trading >40% below their ATHs. The index remains a daunting competitor, with many of the companies within it struggling to keep pace. (As noted by Liz Ann Sonders, less than 10% of the S&P 500 constituents have outperformed the index over the past year.)
I follow or own many companies that would land on the right hand side of the above chart. I ran the ATH data for the 17 companies in the TSOH portfolio, along with 13 other non-portfolio holdings (selected based on the companies I’ve written about most recently). Here’s the data for those select 30 stocks – first, the comparable TSOH drawdown chart to the above S&P 500 data, followed by the percentage change from the ATHs for the 30 companies: