Microsoft: An Enviable Position
Today’s post is sponsored by AlphaSense, the leading market intelligence and search platform that helps investors to make more thoughtful decisions. AlphaSense is a key part of my investment research process, particularly for document search and expert transcripts (a library of 150,000+ proprietary expert transcripts growing by 6,000 per month). On May 21st, AlphaSense is hosting a webinar that is relevant to today’s Microsoft update - a discussion on how the AI platform shift and CapEx surge will impact the cloud, data centers, cybersecurity, and more. Register today to join next week’s webinar.
From “Microsoft: Transition Period” (November 2024):“In the coming quarters, all eyes will be on the Azure / Cloud acceleration. I expect the company to deliver against its objectives (Azure YoY growth reaccelerates to mid-30’s %), providing further evidence that Microsoft holds an enviable position as a leading driver and beneficiary in the cloud / AI transformation.”
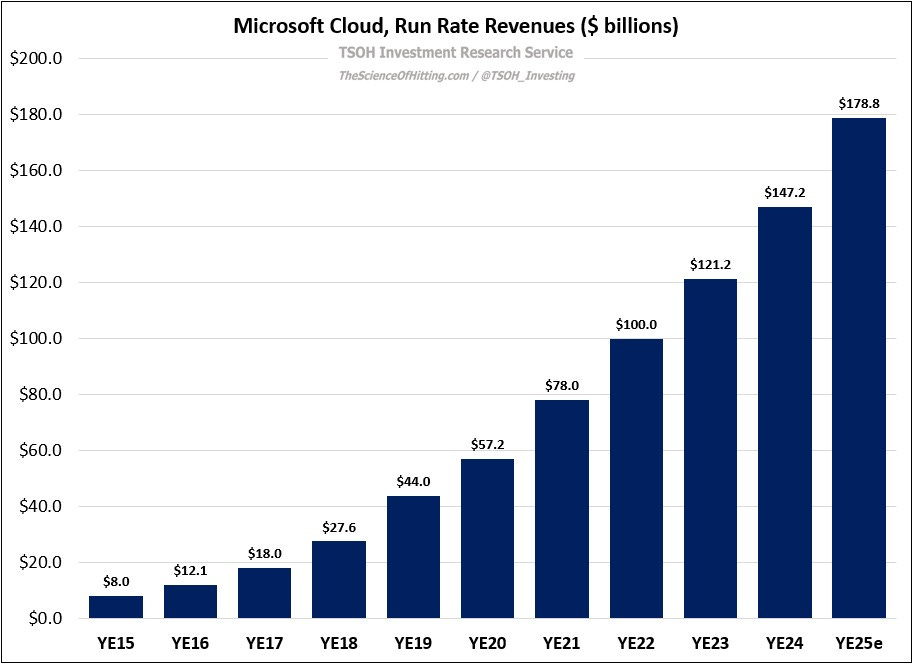
Following mixed signals in Q2 FY25, which I discussed in “The UI For AI”, Microsoft’s Q3 FY25 results were an encouraging step in the right direction. As we zoom out to a longer term perspective, the traction at Microsoft Cloud over the past 5+ years has been truly astounding: the businesses are set to exit FY25 with run rate revenues of ~$179 billion, and with a trailing five-year revenue CAGR of ~26% per annum. (As shown in “The Base Rate Book”, >25% annualized growth over the ensuing five year period has historically been an extremely rare outcome - roughly one third of one percent - for companies that cross $50 billion in sales, as Microsoft Cloud did in FY20.)
As we think about the results within Microsoft Cloud, my focus continues to be on two key components: Azure and Office 365 Commercial. At Azure, constant currency revenue growth reaccelerated to +35% YoY, including 16 points from AI services. Since Microsoft started disclosing Azure growth figures in Q4 FY16 – nearly nine years ago – its constant currency revenues have increased by at least 30% YoY in every quarter expect one (Q4 FY23).
The following chart reveals a notable near term development in the broader marketplace: in the most recent period (corresponds to the calendar quarter), sequential figures for Microsoft Cloud and Azure improved on an absolute and relative basis versus the trends at AWS and Google Cloud. Without reading too much into short-term results, I think this chart, particularly when one considers the relative size of these businesses, supports the argument that Microsoft is taking an outsized share of a large and growing pie, despite formidable competitors. Said more directly, Microsoft is winning in cloud and AI - and I believe this outperformance will continue in the years ahead.
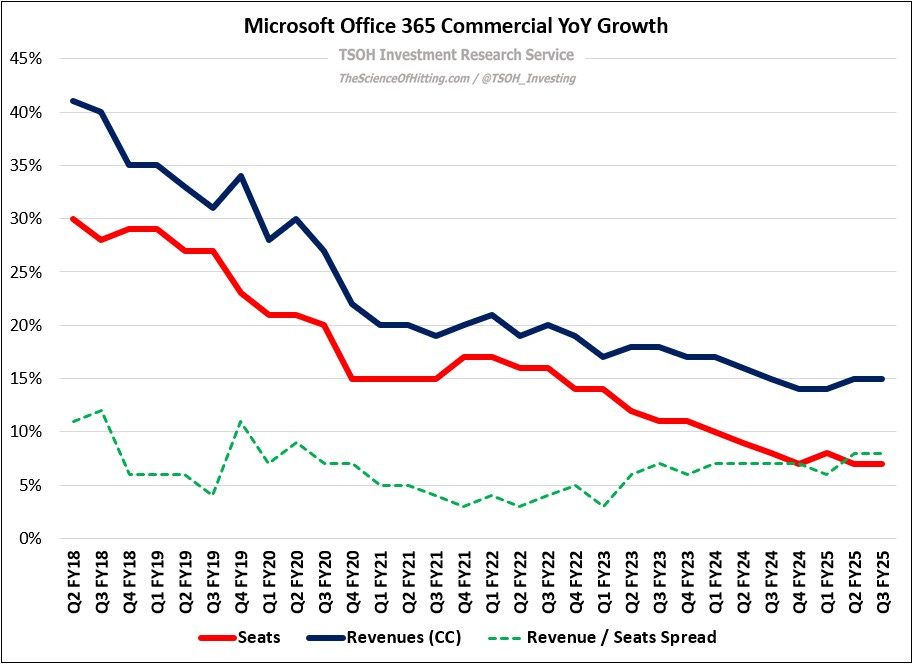
Moving to Office 365 (O365) Commercial, I continue to closely track the figures that can be used to gauge the financial impact / ARPU lift from Copilot adoption (as CEO Satya Nadella noted on the call, the number of Copilot customers was up ~3x YoY, with GitHub Copilot users up ~4x YoY). That said, a reminder that this ARPU metric isn’t perfectly clean given other tailwinds, like E5 adoption, and headwinds, like the impact from lower ARPU frontline / SMB seats. As you can see below, the spread between O365 Commercial revenue growth (+15% YoY) and seats growth (+7% YoY, to more than 430 million paid seats) remains in the high single digits (the dashed green line).
On this topic, CFO Amy Hood said the following: “ARPU growth was driven by E5 and M365 Copilot… While we continue to see installed base expansion across all segments, growth was primarily driven by SMB and frontline workers… Q4 FY25 M365 Commercial YoY revenue growth should be relatively stable to Q3. We expect continued ARPU growth from E5 and M365 Copilot adoption, with some seat growth moderation given the size of the installed base.” Again, while keeping the time frame and the magnitude of the trend change in perspective, this suggests the E5 / Copilot ARPU tailwind is growing. While still in the early innings of the Copilot(s) story, this is a key metric for us to track over time. (As a reminder, management said on the Q2 FY25 call that run rate AI revenues were up ~175% YoY to ~$13 billion; that’s largely attributable to inference and post-training workloads, but also Copilot.)
Financial success is the (hopeful) long-term output. The near term input is the continued evolution and improvement of these tools (to drive efficiency improvements). On that point, I found Nadella’s framing of GitHub Copilot’s evolution at LlamaCon to be particularly insightful. It’s a few steps behind, but there is a similar evolution underway with the future of (knowledge) work. Changing how people and companies approach their daily workflows, even if the tools are a meaningful value add, will be a heavy lift; that said, I see this as a massive long-term opportunity that Microsoft is uniquely situated to capitalize on and monetize (those >430 million O365 Commercial seats).
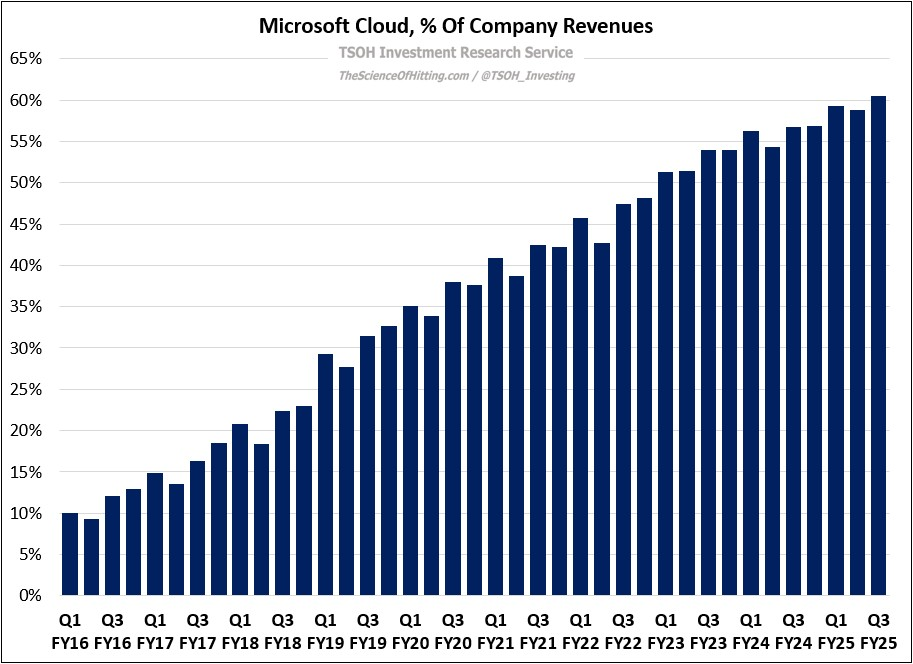
While there are other businesses within Microsoft, Cloud eclipsed a milestone in the quarter that speaks to its importance: it now accounts for more than 60% of Microsoft’s total revenues, a metric that was in the mid-30’s (%) five years ago. Stellar Cloud results are the primary reason why revenues are expected to climb by a mid-teens rate (%) in FY25, to roughly $280 billion.
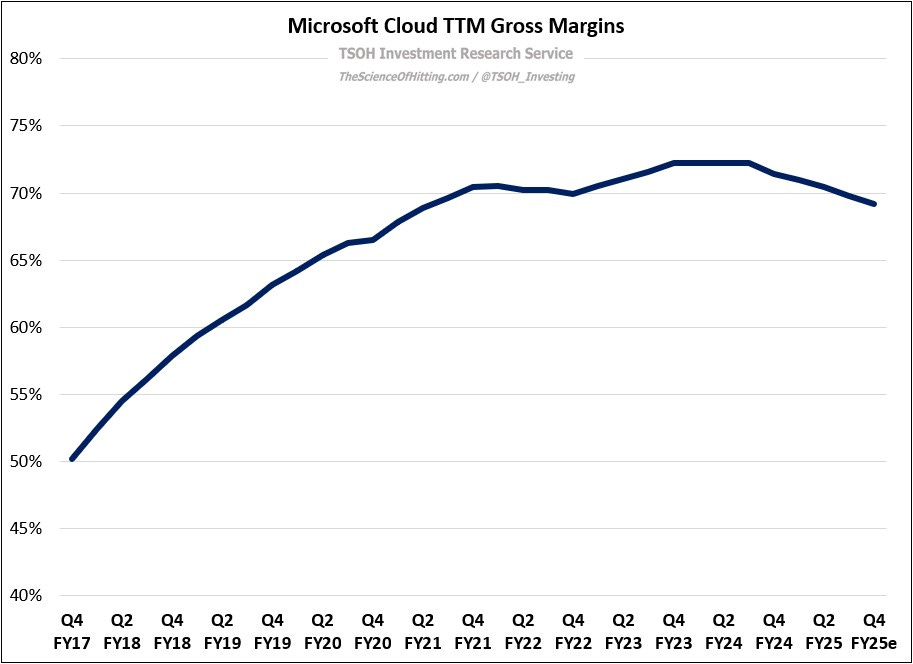
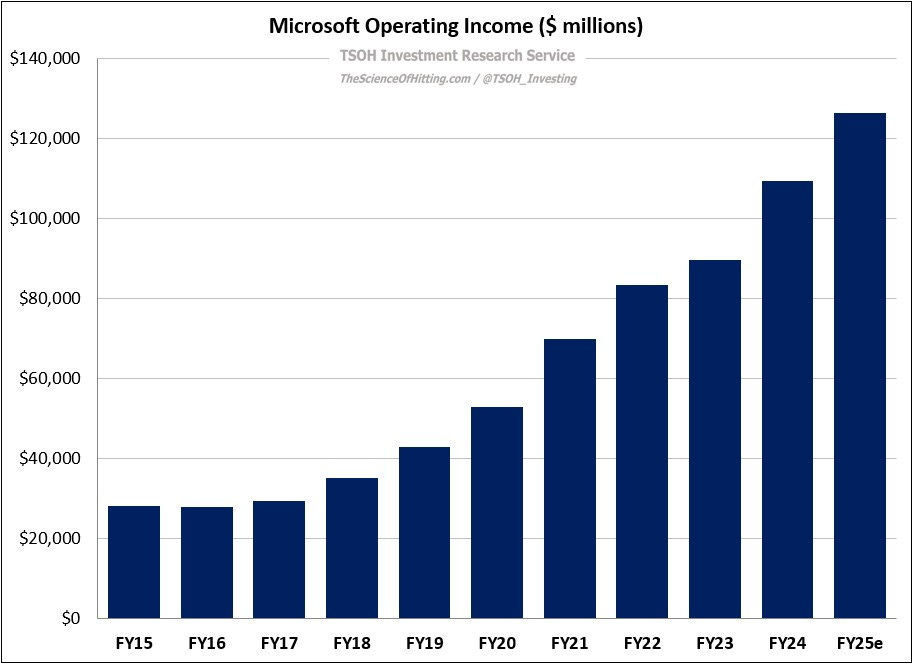
And despite near term gross margin pressure from the AI investments, with FY25e Cloud gross margins of ~69% coming in ~200 basis points lower than FY24, Microsoft’s ongoing focus on operating expense efficiency is enabling EBIT margin expansion in FY25e, to ~45%. All-in, the company is on track for FY25 operating income of ~$126.5 billion, with a trailing ten-year CAGR of +16%. Both strategically and financially, Microsoft is firing on all cylinders.
Conclusion
As discussed in “Capex Conundrum”, the astounding level of investment behind the AI platform shift is making the cloud investments of the mid-2010’s look like a drop in the bucket. That said, management has clearly explained their thought process to investors, along with providing relevant context on the structure of that CapEx spend. (“Roughly half of our cloud and AI-related spend was on long-lived assets that will support monetization over 15+ years. The remainder is primarily for servers, CPUs and GPUs, to serve customers based on demand signals, including our contracted backlog of $315 billion.”)
For me, an important part of the long-term Microsoft thesis - which has been a large position in the TSOH portfolio since 2011 – is earned trust (this is an idea that isn’t easily quantified, which is problematic if you operate with an investment approach that frames decision-making in terms of price targets and expected returns). It’s clear that Nadella had a strong sense for how Microsoft’s most important businesses were likely to change over time, and he has acted with conviction to ensure that the company was positioned to compete and win where it matters most. This is a key reason why Microsoft’s hand is much stronger today than it was when Nadella took charge in 2014.
Similar to my desire to own great businesses, I also want to truly partner with great leaders. Microsoft is the rare bird that passes both tests, and it should be treated accordingly. While the stock doesn’t appear cheap at ~32x FY25e EPS, the valuation becomes much more palatable once we account for (my expectation of) sustained mid-teens EPS growth over the next five years.
Personally, I have only been able to own Microsoft, particularly in the past five years or so, because I continually balanced near term valuation concerns with an appreciation for this truly unique business and management team.
That has meant accepting periodic air pockets, and the recent stock price decline of about 25% - from the middle of December to early April – will not be the last time that MSFT shares trade well off the highs. Those periods aren’t fun, but they are an unavoidable part of owning a publicly-traded company. While I may periodically trim it around the edges, as I did most recently in June 2024, I suspect that Microsoft will continue to be a top position at TSOH (~10% of the portfolio as of the most recent update).
Note - This is not investment advice. Do your own due diligence.
I make no representation, warranty, or undertaking, express or implied, as to the accuracy, reliability, completeness, or reasonableness of the information presented in this report. Assumptions, opinions, and estimates expressed in this report constitute my judgment as of the date thereof and are subject to change without notice. Projections are based on a number of assumptions, and there is no guarantee that they will be achieved. TSOH Investment Research is not acting as your advisor or in any fiduciary capacity.


