April 2021 Portfolio Review, Part 1
An in-depth review of my investment portfolio
Welcome to the first paid post of the TSOH investment research service.
The fact that you’ve made a commitment of your time and money is something I take seriously. I’ll do all that I can to ensure your investment proves worthwhile. If you have questions or would like to access research materials, let me know.
With that, let’s get to work.
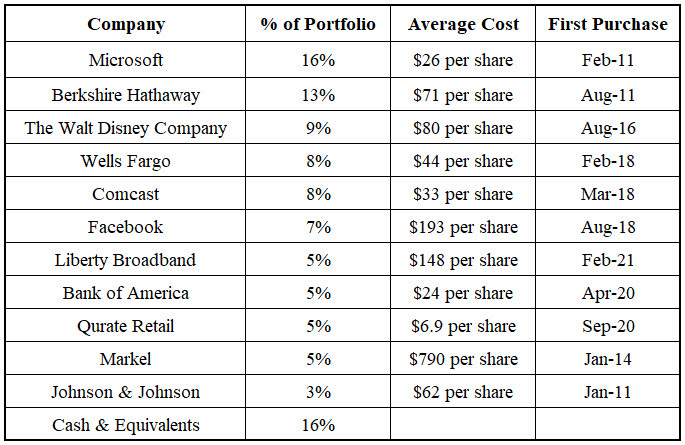
As outlined in the introductory post for the service, I will provide complete access to my research process and portfolio decision-making. A good place to start is my current portfolio (as of 03/31/21), which is the culmination of all of my prior research and investment activity. (Note: I needed to break down the review into three parts to stay below size limits imposed by email providers like Gmail.)
The portfolio shown above includes every dollar of investable assets that I have to my name outside of a checking account (a rainy day fund) and a 401(k).
The current allocation reflects the fact that I’m in my early 30’s and plan on being a net saver for 20+ years. As a general rule, it’s my intention to be fully invested. One other factor, which explains the larger than average cash balance, was a realization in late 2020 that I had become too diversified (by my standards). A number of smaller (1% - 3%) positions had found their way into the portfolio, so I gave myself a choice: buy more or sell. Going forward, I will only initiate a new position if I’m comfortable making it ~5% of the portfolio out of the gates.
Microsoft (MSFT) – First purchase in Feb 2011, avg cost of ~$26 per share
Microsoft’s mission is to help every individual and organization around the world - from SMB’s to Fortune 500 companies – to achieve more. Over the past decade, as digital transformation became an imperative for every company and industry - and even more so since 2020 as a result of the pandemic - Microsoft has invested aggressively to innovate across every layer of the modern tech stack (the success of which is evident in CIO surveys, which consistently feature Microsoft as a top strategic IT vendor). For CEO Satya Nadella, being an industry leader in a “cloud first” world has been a primary focus since his tenure began in 2014. In the years ahead, the opportunities that will surface from leadership in cloud computing, AI / ML, BI and analytics, and digital transformation, will be unfathomably large – and no company is better positioned than Microsoft. This is most apparent when looking at the company’s Commercial Cloud businesses.
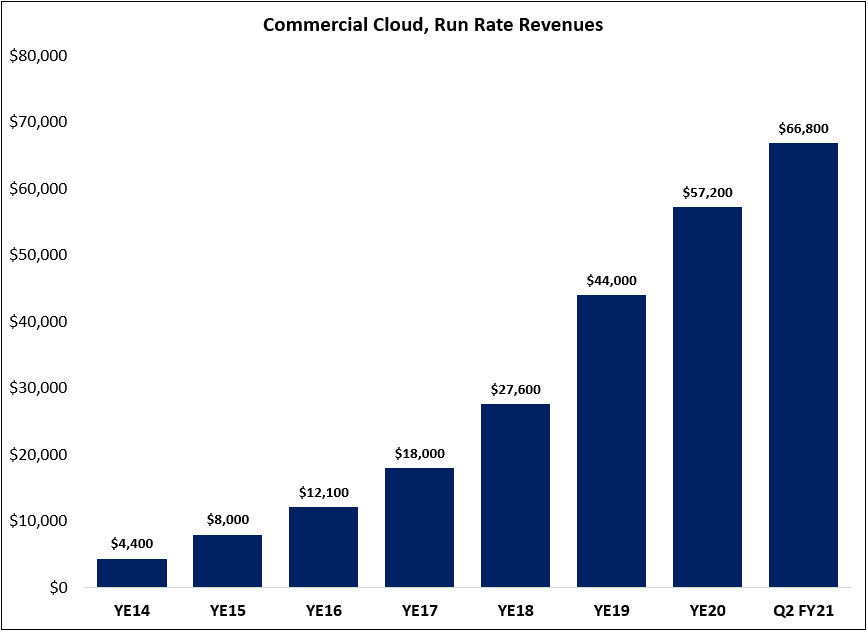
When Nadella became CEO, the Commercial Cloud businesses – primarily Azure and Office 365 Commercial - generated less than $5 billion in annual revenues. In April 2015, Nadella set a goal of $20 billion in Commercial Cloud (run rate) revenues by the end of fiscal 2018. As shown below, the company comfortably exceeded that target (~$28 billion at the end of FY18) and has kept growing ever since: run rate Commercial Cloud revenues in Q2 FY21 were nearly $67 billion.
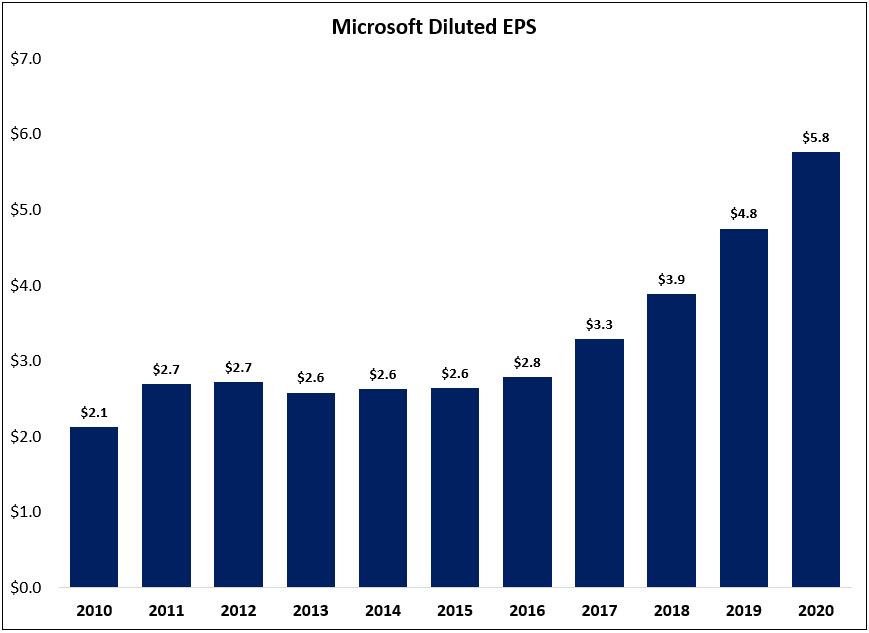
Remarkably, even on a large base, Commercial Cloud revenues increased 34% year-over-year in Q2. Microsoft’s comprehensive presence across the cloud stack (infrastructure, platforms, and applications) has been a primary driver of double digit EPS growth in the past few years – an outcome that can be repeated as the cloud businesses continue to scale (research firm Gartner estimates that cloud penetration of the long-term enterprise IT market opportunity is still below 20%).
The company’s future prospects have not gone unnoticed by Mr. Market. While I feel very confident about Microsoft’s financial position, management team, and long-term opportunities, those are not the only considerations. Like a bettor at the racetrack, the question to answer is whether the odds currently offered are attractive. This requires a view on business prospects and valuation. If an investment is made in this company’s shares for the next decade from current levels, is there reason to believe that the returns are likely to be attractive?
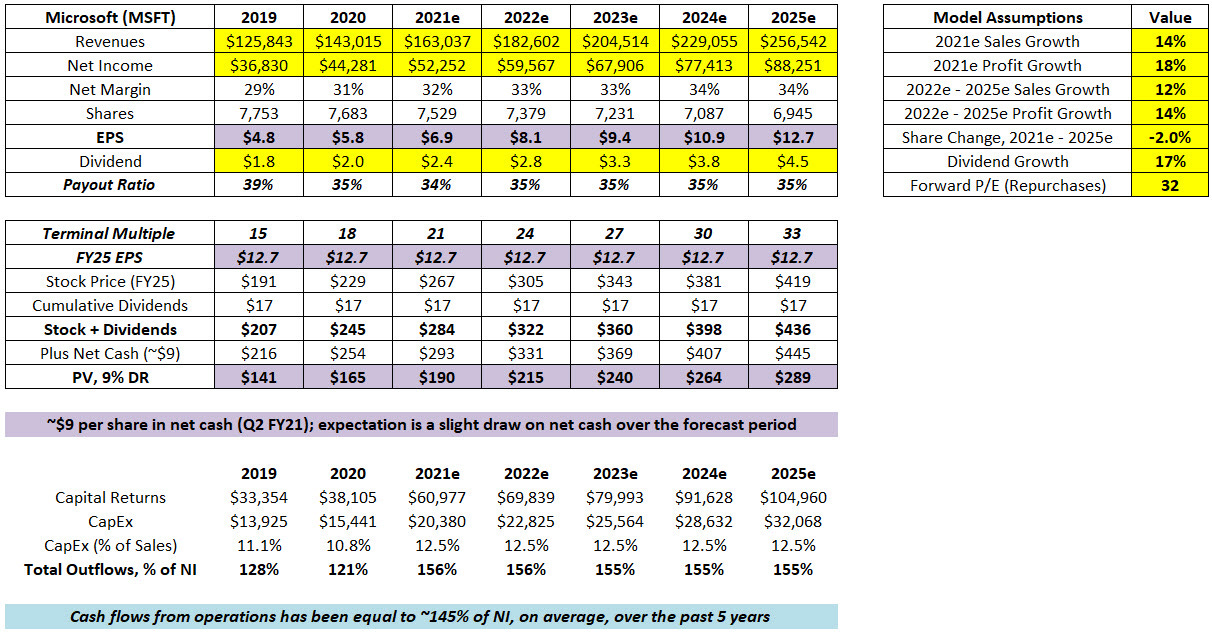
Here’s my current financial model for Microsoft:
In five years, I expect EPS to approach $13 per share, or ~19x today’s stock price ($242 per share). I believe a reasonable fair value range for Microsoft is $190 to $290 per share (low 20’s to low 30’s terminal P/E). As such, assuming the company delivers double-digit revenue growth and high-teens EPS growth through 2025, I believe the stock is reasonably valued (which I define as priced to deliver at least high-single digit annualized TSR’s over the next five years).
In summary, Microsoft is a wonderful business with a fortress balance sheet and a best-in-class management team. At a low-30’s P/E, it trades at a clear premium to the S&P 500 – and while this business deserves a meaningful premium to the market, the question is “how much”? My answer, which also considers the large weighting of the position in my portfolio, is that it would be imprudent to suck my thumb if the price meaningfully exceeds the high end of that range (now I can appreciate how Buffett felt with his Coca-Cola position in the late 1990’s).
If Microsoft trades up towards ~$290 per share, I may be forced to take action.
Berkshire Hathaway (BRK.B) – First purchase in Aug 2011, avg cost of ~$71 per share
Berkshire Hathaway is a collection of wholly-owned businesses (subsidiaries) and investments that have been cobbled together by Warren Buffett and Charlie Munger over the past 56 years. Today, Berkshire’s value primarily resides in a handful of areas, including the property/casualty insurance operations (GEICO, reinsurance businesses, etc.), Class I railroad Burlington Northern Santa Fe, the utility and energy businesses within Berkshire Hathaway Energy (BHE), and publicly owned securities (most notably a ~$110 billion stake in Apple).
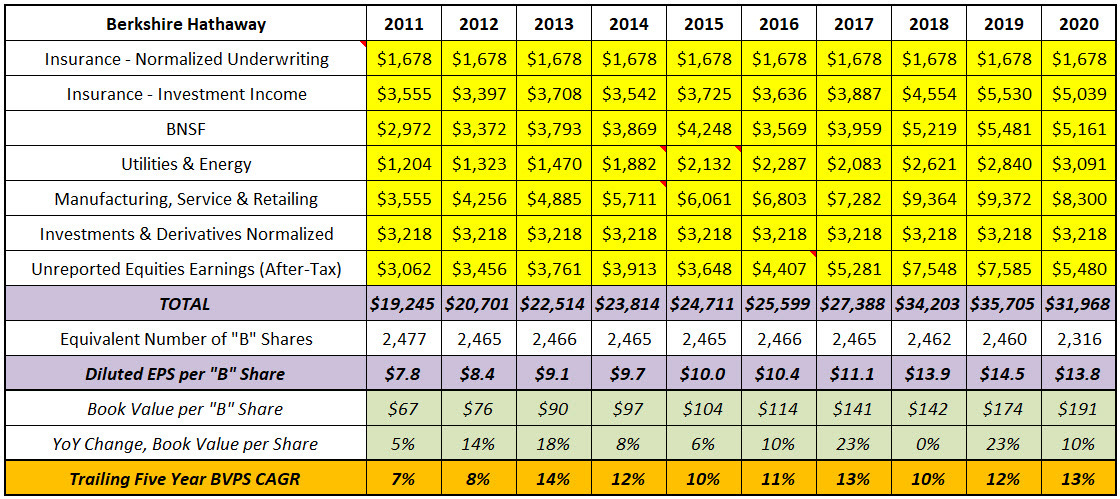
When valuing Berkshire, my approach is to look at the earnings of the operating businesses (BNSF, BHE, etc.), with a few adjustments to normalize the volatile line items (for example, insurance underwriting). On this basis, run rate earnings at Berkshire in 2020 were ~$26 billion, down from 2019 given COVID-related pressures throughout the year. Inclusive of the unreported retained earnings from Berkshire’s marketable securities holdings, after-tax normalized (look through) earnings were ~$32 billion in 2020, or ~$14 per Class B share (this does not include any premium for the optionality offered from excess cash balances).
Over the next 5 - 10 years, I expect Berkshire to increase normalized EPS and book value per share (BVPS) at a high single digit CAGR (at least), with a much lower probability of adverse outcomes than the average S&P 500 company over a similar time horizon. The position is a ballast in my portfolio, with capped upside (the days of compounding at ~20% p.a. are long gone) offset by limited downside risk (in terms of intrinsic value, not price action; with meaningful repurchases on the table, as evidenced by ~$25 billion of buybacks in 2020, shareholders should welcome lower prices in the short-term). During those inevitable tough stretches for the economy and markets, I expect management to utilize excess liquidity for acquisitions, repurchases, and other investments. No matter what lies ahead, I remain comfortable with the hand Berkshire holds, as well as with the short list of individuals likely to take charge after Buffett and Munger (As Munger said in 2019, “It’s amazing how good this next generation [Jain, Able, Combs, and Weschler] is, and they’re steeped in our non-bureaucratic ways.”)
The Walt Disney Co. (DIS) – First purchase in Aug 2016, avg cost of ~$80 per share
In “The Ride of A Lifetime”, former Disney CEO Bob Iger discussed a memorable trip to Hong Kong Disneyland in 2005. While watching the Main Street parade on opening day, he noticed that barely any of the Disney characters in the procession were created in the previous decade. The company’s once thriving animation studio, which exhibited great success in the early 1990’s with movie like Aladdin and The Lion King (one of the highest grossing animated films of all time), had fallen into disrepair. Upon further research, Iger also learned that Pixar, which became a household name following the 1995 release of Toy Story, had eclipsed Disney among mothers with young children (“In a head-to-head comparison, Pixar was far more beloved – it wasn’t even close.”). In that moment, Bob Iger realized the crucial role high-quality branded content creation played at The Walt Disney Company. “As Animation goes, so goes the company.”
This insight ultimately led to three transformational deals that would greatly expand the portfolio of branded storytelling at Disney: the 2006 acquisition of Pixar for $7.4 billion (a deal that Iger proposed to the board on his second day as CEO), the 2009 acquisition of Marvel for $4 billion, and the 2012 acquisition of Lucasfilm (the Star Wars and Indiana Jones franchises) for $4 billion.
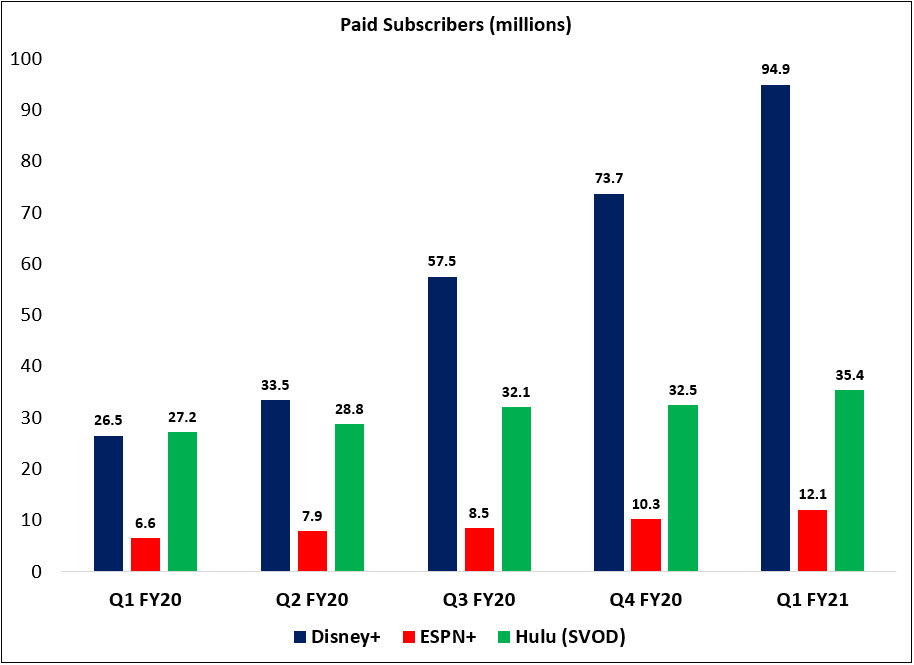
In large part because of these acquisitions, Disney is home to the most valuable media brands (IP) in the world, along with the most effective means for monetizing those assets (a position that took decades to build and has proven very difficult for others to replicate). The most recent example of Disney’s unrivaled global brand strength came in November 2019 with the launch of the company’s namesake direct-to-consumer (DTC) subscription video on demand (SVOD) service, Disney+. In the first 18 months, Disney+ has already crossed 100 million paid subs – exceeding the high end of management’s range of 60 to 90 million subs for the first five years (set in April 2019).
As outlined at the December 2020 Investor Day event, the company is leaning on its five core brands - Disney, Pixar, Marvel, Lucasfilm (Star Wars), and National Geographic - to produce 100+ new titles a year, which will result in continued subscriber growth, higher engagement, lower churn, and the ability to charge higher prices (higher ARPU’s). In the years ahead, Disney will significantly ramp content investments, which as CEO Bob Chapek recently noted, reflects “alignment of all of our interests towards our strategic imperative of DTC”.
Updated guidance anticipates 300 - 350 million global DTC subs by the end of fiscal 2024. If you assume Disney takes pricing, as I do (mid-to-high single digit annualized), DTC revenues will exceed ~$30 billion in 2025, compared to global DTC content investments of ~$20 billion a year (guidance at ~$15 billion, but I expect upward revisions). The point is that an offering like Disney+ (or a collection of services like the Disney bundle in the United States) with broad consumer appeal and high-quality branded content that commands premium pricing will have attractive economics at scale. I can’t predict the timing with any specificity, but I am very comfortable betting that Disney ultimately gets there – and at that point, the DTC businesses will be incredibly valuable.
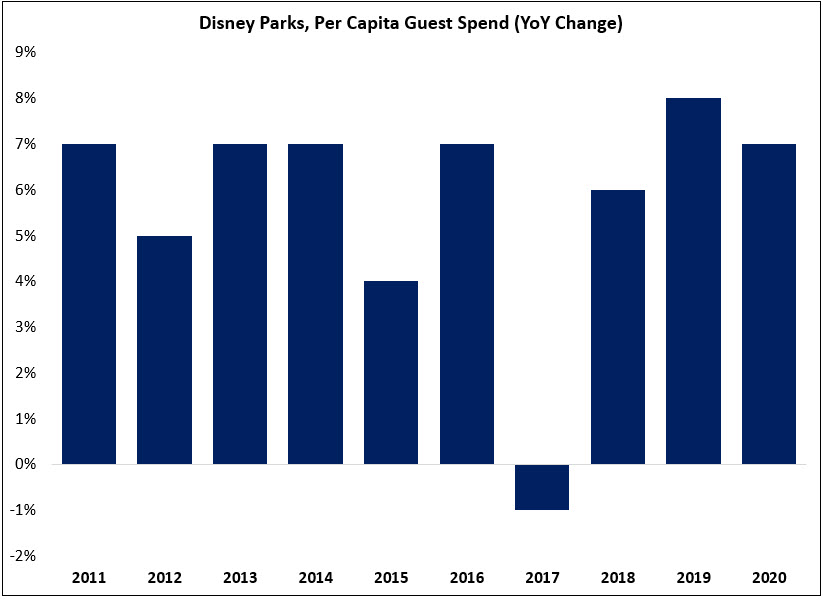
In addition to the DTC businesses, investors own cruise lines, resorts, and theme parks (eight of the top ten in the world based on guest attendance in 2019), a collection of leading movie studios (global box office of $11.1 billion in 2019, shattering the previous record - $7.6 billion - which was also held by DIS), and a consumer products / merchandise licensing business. Collectively, these businesses generated nearly $10 billion of operating income in 2019 (pre-pandemic). While they face significant headwinds in the short-term, widespread distribution of a vaccine provides line of sight to a recovery. Notably, Disney has used this period to reconsider pricing / capacity (attendance) constraints at the parks, both to improve the guest experience and to create incremental value for owners; as a result, expect per capita guest spend to keep growing in the years ahead as the company continues to perfect product segmentation and dynamic pricing. (Iger, on his predecessor Michael Eisner: “Michael’s biggest stroke of genius might have been his recognition that Disney was sitting on tremendously valuable assets that they hadn’t yet leveraged. One was the popularity of parks. If they raised ticket prices even slightly, they would raise revenues significantly without any noticeable impact on the number of visitors.”)
(Note: Decline in FY17 primarily reflects the impact of the Shanghai opening.)
The final consideration is the company’s exposure to the structural decline of pay-TV in the U.S. (Disney owns channels like ESPN, ABC, FX, etc.). The Cable Networks and Broadcasting segments collectively generated $28.4 billion in revenues in 2020, or more than $25 per month from each of the roughly 80 - 85 million remaining pay TV subs. Assuming the U.S. pay TV universe shrinks to 50 million subscribers by 2025 (~10% annualized decline, compared to low-single digit declines in the past five years), that would create a $10 billion revenue hole for Disney. Offsets to that headwind will come from higher per sub affiliate fees (what Disney charges distributors like Comcast and YouTube TV to carry its channels) and improvements in other parts of the video business (incremental DTC subs, higher ARPU’s, improving the Disney bundle mix, etc). While those counterbalances will materialize with time, I am increasingly convinced that an acceleration in the pace of pay TV sub declines is likely given the actions of companies like NBCUniversal, ViacomCBS, and Disney itself (moving their best programming, including sports rights like the NFL, to their DTC offerings).
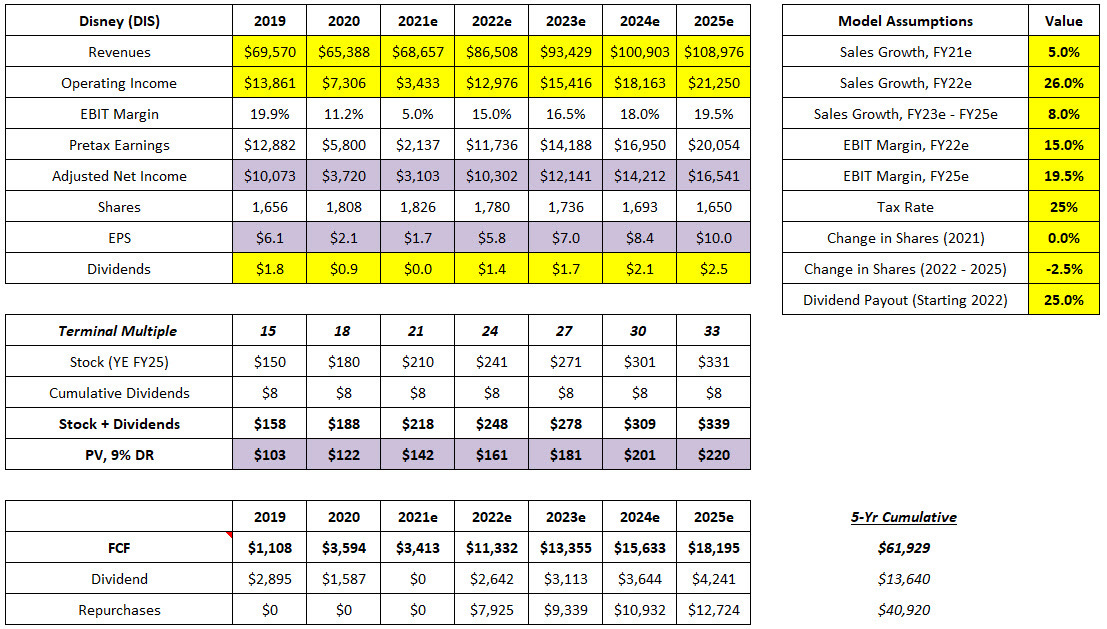
Here’s my current financial model for The Walt Disney Company:
Naturally, the results in 2020 and 2021 are messy given the impact of the pandemic on theme parks and movie theaters on the top and bottom lines, as well as digesting DTC investments. My working assumption is the parks will return to normal throughout 2022, which will add ~$10 billion in revenues (dependent on timing). I also believe the growth rate for Disney as a whole will remain elevated through 2025 as a result of the company’s global DTC efforts.
As we look out to the end of the forecast period, which assumes a return to normal at parks and movie theaters, as well as improved results for DTC as it achieves global scale and commands higher ARPU’s, the power of Disney’s model becomes apparent. On my numbers, the company is likely to generate ~$17 billion in earnings, or ~$10 per share, in 2025. For context, Disney generated ~$10 billion in earnings in 2018 and 2019. As we think about a return to growth for theme parks and a transition for DTC from losing a few billion dollars a year to making a few billion dollars a year, I think that forecast passes the smell test. (I feel similarly on revenues: at ~$109 billion in 2025, assuming DTC meets my expectation of at least $30 billion by that time, the model implies that the rest of Disney would need to be roughly flat over the forecast period).
The terminal P/E multiple required to justify today’s price ($189) is ~28x 2025e earnings, which doesn’t jump off the page as an attractive valuation. That said, Disney will still be in the early innings of their DTC efforts at that time, at least in terms of normalized profitability. Looking out to 2030 and beyond, I ultimately believe that Disney’s DTC businesses will collectively generate operating income of $10 billion or more (by comparison, EBIT for the entire company was ~$14 billion in 2019). For that reason, I’m comfortable giving this position a long leash.
Wells Fargo (WFC) – First purchase in Feb 2018, avg cost of ~$44 per share
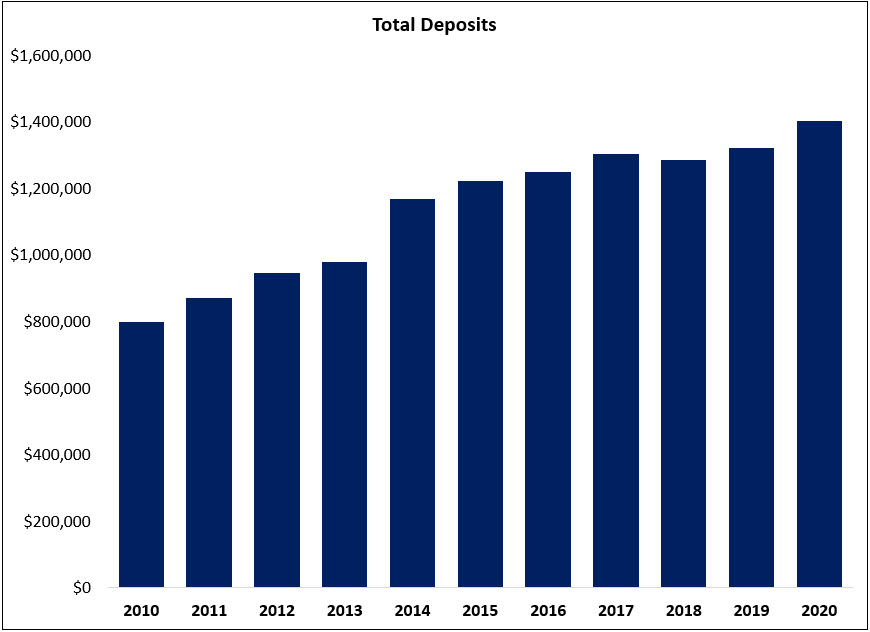
At its core, my investment is Wells Fargo is based upon the value of the company’s large, low-cost consumer deposit base. As shown below, despite the many issues the company has faced in recent years, total deposits have continued to grow at a mid-single digit rate (trailing five-year CAGR of 6%).
Wells is one of the largest financial institutions in the country, accounting for ~10% of U.S. retail deposits (roughly comparable to Bank of America and J.P. Morgan; as of early 2019, these three banks had more retail customers than the next 20 largest U.S. banks combined).
As a result of its significant scale, Wells (like BAC and JPM) can support a level of investment in its business that smaller competitors cannot match (for example, WFC tech spend is currently ~$10 billion a year). This is one reason, among others - like the convenience of a national branch and ATM network - why the big keep getting bigger: since 2010, the largest U.S. banks (at least $100 billion in assets) have gained roughly five points of deposit market share.
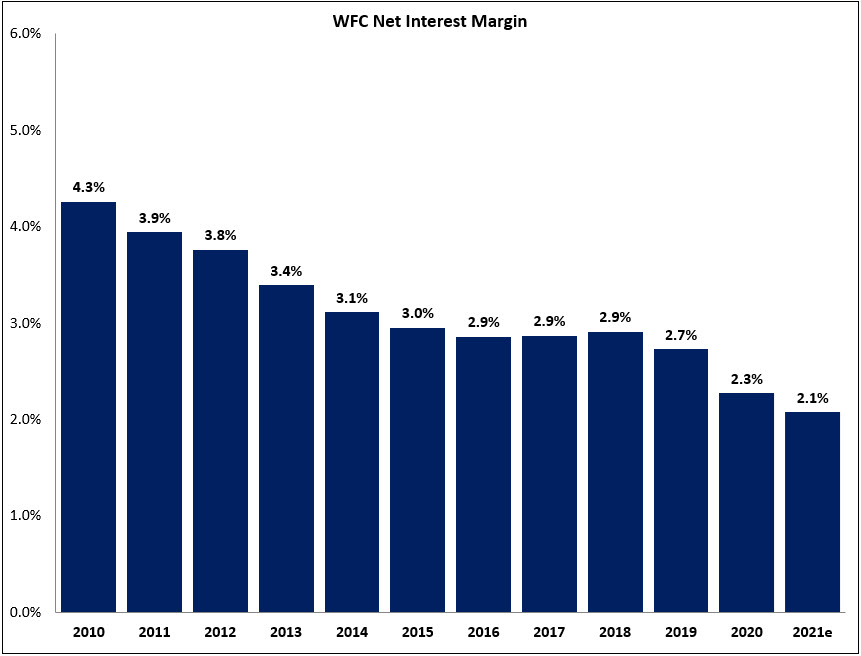
While deposit growth is a good start, those resources must also be effectively allocated. As shown below, net interest margin (NIM) - the difference between the yield on loans, securities, and other interest-earning assets less the cost of funding sources like consumer deposits – has contracted by ~200 basis points (BPS) over the past decade. As a result, despite a ~70% increase in earning assets, net interest income (NII) in 2021 (~$36 billion) will be ~20% lower than in 2010 (~$44 billion). This is entirely due to NIM compression, with the contraction in asset yields far outpacing the decline in funding costs (deposit rates can only go so low). On more than $1.7 trillion in interest-earning assets (supported by liabilities like deposits and long-term debt), every 10 basis point improvement (0.1%) in NIM adds ~$1.7 billion in pre-tax net interest income (NII). Relative to a current market for WFC of ~$165 billion, the prospect of even a 50 basis point improvement in NIM – an incremental ~$9 billion in pre-tax NII- is noteworthy.
Of course, what if permanently lower NIM’s have become the “new normal” in this interest rate environment? In that scenario, I assume the remainder of my portfolio - where future cash flows are less sensitive to rates – is likely to benefit (all else equal, a lower discount rate will result in a higher present value). In the context of a portfolio, I believe Wells and Bank of America (discussed below) are reasonable ways to hedge against interest rate risk (that assumes through-the-cycle deposit betas hold at 35% - 40%, similar to the 2015 – 2019 hiking cycle).
Company-specific developments deserve some attention as well. In October 2019, Charlie Scharf became the CEO of Wells Fargo. Since day one, Scharf, who previously served as the CEO of Visa and BNY Mellon, has been clear that his most important job is to improve the bank’s relationship with its regulators. Publicly, he has been quiet about the company’s progress (avoiding the mistake of his predecessor) but press reports in early 2021 indicate these efforts are bearing fruit (suggested the Fed has accepted the company’s risk management and compliance overhaul, a necessary step to remove the asset cap). The timing remains uncertain, but I am increasingly confident these lingering issues will be largely resolved by year-end 2022.
In addition to regulatory issues, Scharf has begun the process of addressing the company’s outsized expense base. As noted on the Q4 call, management has line of sight to at least $8 billion of cost savings (gross), which they expect to address over the next 3 - 4 years (with nearly $4 billion of gross savings in 2021 expected to result in $1.5 billion net to the bottom line). In addition, the industry as whole is likely to become more efficient over time through digitization and network consolidation (closing branches), with large banks as the primary beneficiaries.
The final consideration relates to business quality. To return to the discussion in “Returns and Lessons Learned”, is the company losing some standing in the eyes of its customers relative to the competition? I think the jury is still out on Wells (and large banks generally), but I’m open to the idea that a business with ~low-single digit customer growth and a budding list of startups looking to cross its moat no longer qualifies as high-quality. Consider me undecided for now.
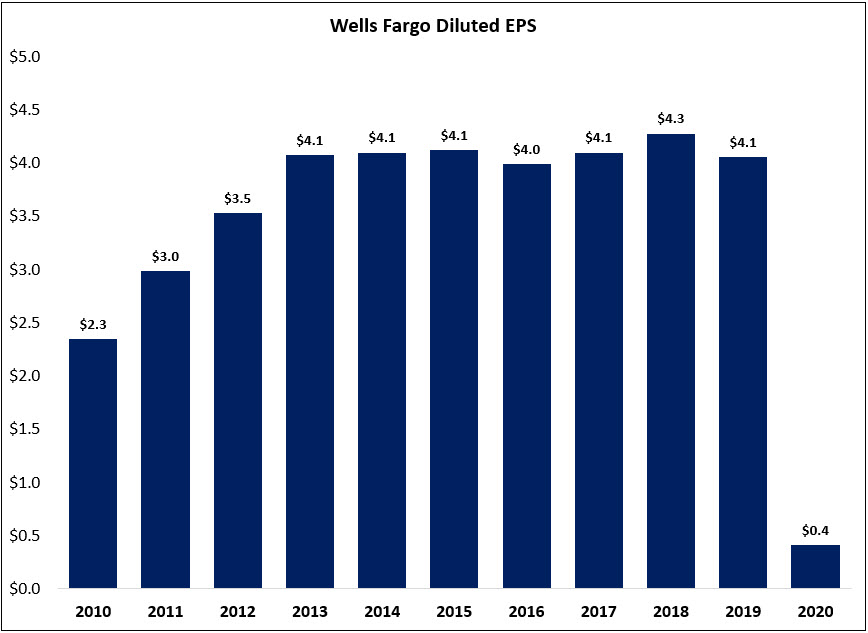
Diluted EPS has flatlined at ~$4 per share since 2013, with NIM / NII headwinds and a decline in noninterest income (primarily mortgage banking) offset by a lower share count.
My expectation is that EPS will return to ~$4 per share in the next 2-3 years, with potential upside from an improved efficiency ratio, higher NIM / NII, removal of the asset cap, and repurchases. With the stock trading just shy of $40 per share, I believe the valuation remains undemanding. That said, without real improvement in the underlying business results, that may prove justified.
Part 2 and 3 of the portfolio review are available here or in your email inbox.
NOTE - This is not investment advice. Do your own due diligence. I make no representation, warranty or undertaking, express or implied, as to the accuracy, reliability, completeness, or reasonableness of the information contained in this report. Any assumptions, opinions and estimates expressed in this report constitute my judgment as of the date thereof and is subject to change without notice. Any projections contained in the report are based on a number of assumptions as to market conditions. There is no guarantee that projected outcomes will be achieved. The TSOH Investment Research Service is not acting as your financial, accounting, tax, or other adviser or in any fiduciary capacity.


Hey Alex,
Would you be willing to share what you invest in within your 401K, even if just a general note (ie "index funds")? I'm trying to decide how to structure my different brokerage accounts and it would be super helpful to know how you approach your retirement account.
Thanks so much!
Hi Alex, Thanks for sharing the review of your portfolio !! Would it be possible to share the rationale behind not having any exposure to REITS, Utilities ,Energy stocks and Industrials ?