The House Of Sport
Dick's Sporting Goods (DKS) initiation
Ed Stack, former CEO of Dick’s Sporting Goods: “We never fell in love with ourselves… Other retailers really didn’t innovate, and the market passed them by… We need to build the concept that will kill Dick’s Sporting Goods.”
As a follow up to Thursday’s research report on Academy Sports + Outdoors (ASO), today’s discussion will examine the leading U.S. sporting goods retailer, Dick’s Sporting Goods (DKS). As we examine the company’s results over the past decade, along with their evolving strategic vision and capital allocation priorities, I think there are clear parallels to another retailer that has been a huge winner for investors: Home Depot. As we walk through that comparison, readers should also consider how Mr. Market views / values Dick’s compared to Academy; to me, it suggests ASO management should revisit how their weigh their strategic priorities and capital allocation plans, particularly on the question of new unit expansion versus elevating the base.
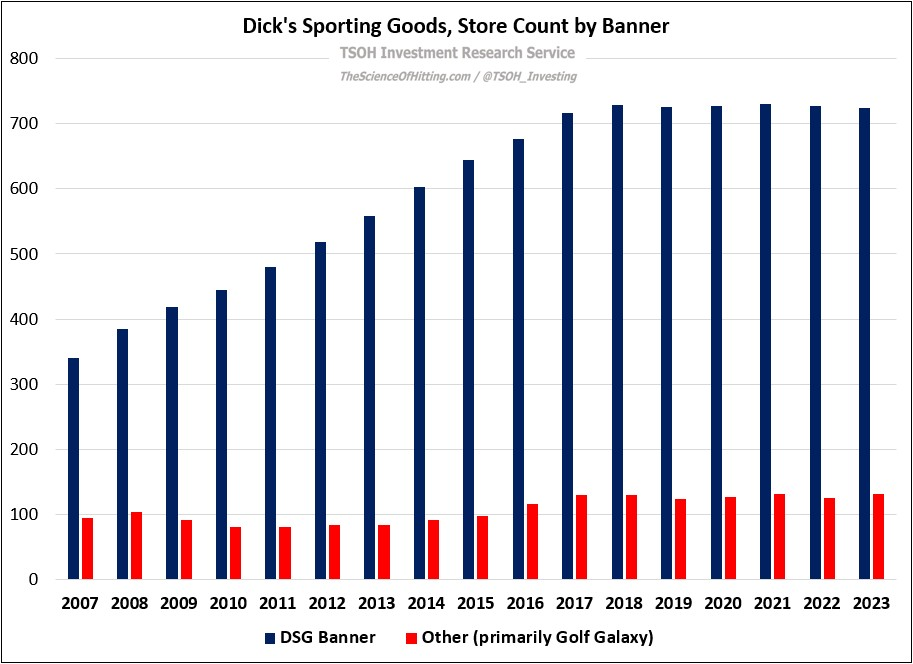
The first thing to note on Dick’s is they’ve effectively stopped building net new stores, which is a significant change in trend from the pre-2018 strategy: the company ended 2023 with 855 total stores, down slightly from five years earlier. More than 80% of those stores operate under the namesake banner, Dick’s Sporting Goods, with the remainder largely attributable to Golf Galaxy. (Dick’s acquired the Golf Galaxy banner in February 2007 for $227 million.)
While the company has pumped the brakes on new units, revenues have continued to climb higher (FY19 – FY24e CAGR of +9%). That reflects the greater than 50% increase in revenues per average store (AUV’s), from ~$10.2 million in FY19 to ~$15.5 million in FY24e. As discussed Thursday, comps at Dick’s have meaningfully outpaced the results at Academy.
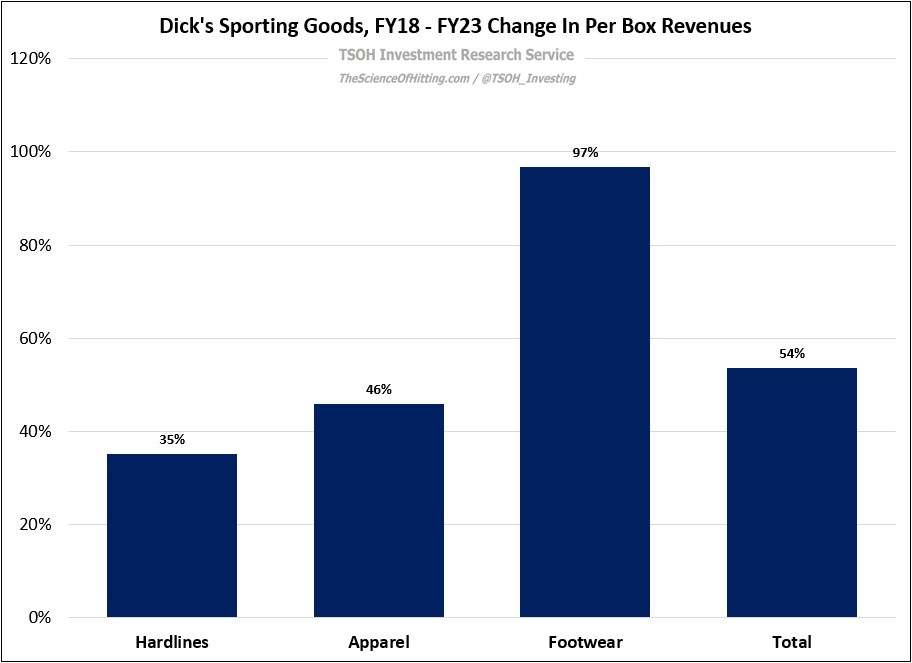
Looking by category, we can see that the improvement at Dick’s has been led by footwear: per store revenues roughly doubled over the past five years, from ~$2.0 million in FY18 to ~$4.0 million in FY23 (the company doesn’t provide category disclosures on a quarterly basis). Again, that reflects a markedly better outcome than Academy, where per store footwear revenues increased by ~10%, from ~$4.0 million in FY18 to ~$4.5 million in FY23.
What explains this large discrepancy?


