The Home Depot: "Intense Focus"
“It’s hard to be excellent… excellence takes intense focus.”
- Former Home Depot (HD) CEO Frank Blake
On April 14th, 1978, Bernie Marcus and Arthur Blank, who jointly ran a company called Handy Dan, found themselves in an unfamiliar position; after many years of effective leadership at the home improvement chain, they were summarily fired by the CEO of Handy Dan’s parent company (“He can’t stand to see you succeed… It’s your funeral.”). The next morning, while the wound from the prior day’s events was still fresh, Marcus received a call from Ken Langone, an investment banker who was friends with the Handy Dan duo.
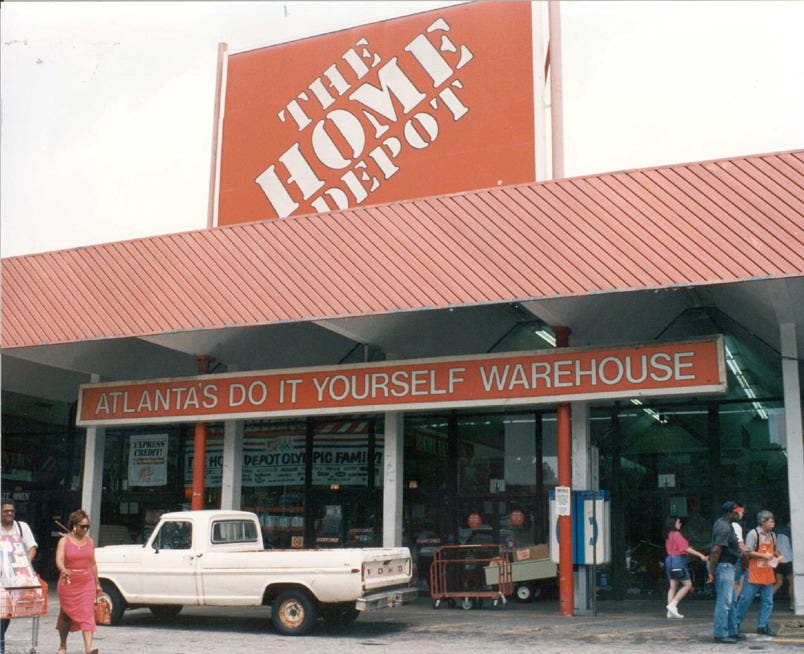
What Langone said surprised Marcus: “This is the greatest news I have ever heard.” As he went on to explain, this was a chance to embark on a new venture, to start the reimagined home improvement concept that Marcus and Blank had previously discussed. (“Our vision was of an immense warehouse store, anywhere from 55,000 to 75,000 square feet and with high ceilings… We would have immense amounts of merchandise and great assortments, stacked to the ceiling, so consumers would be overwhelmed when they walked in, and they would virtually smell a bargain.”) With time, Langone’s comment would prove profoundly prescient: in June 1979, just 14 months after they were fired from Handy Dan, the first Home Depot stores opened near Atlanta, Georgia; today, The Home Depot operates a chain of ~2,300 stores, primarily in the United States, with FY22e revenues of ~$158 billion.
The Two Eras of HD
Over the past 30+ years, The Home Depot has lived through two distinct periods. In the first era, which ended in the mid-2000’s, the company’s growth algorithm primarily relied on building new stores. From a starting point of less than 200 stores at yearend FY1991, the unit count increased more than 10x over 16 years, to 2,234 stores at the end of FY2007 (~17% CAGR).
But as you can see below, new unit growth came to a screeching halt during the 2007 – 2009 financial crisis; at the end of FY21, Home Depot’s unit count was <5% larger (cumulative) than in FY07. Frank Blake, who became HD’s CEO in early 2007, reflected on the decision to bring new store growth to a halt in an August 2020 interview: “The more interesting decision was not building new stores... Not only did we stop building new stores, but we took a $500 million write-off taking all the stores out of our pipeline… [It was obvious to me that] we were putting stores in places that couldn't support a Home Depot.” (2008 investor conference: “We are no longer about new store growth. It's about driving productivity in the assets we deploy.”)
Before digging deeper on the impact from that critical turning point for The Home Depot (the decision to stop building new stores), it’s interesting to think about what shareholders lived through over the past 20 years. The stock price, which crossed $60 per share in March 2000 (when new unit growth was charging ahead at a rapid clip), had fallen below $30 per share by the end of the decade. As opposed to the high flyer multiple that it garnered at the turn of the century (roughly 50x forward P/E in March 2000), HD started the 2010’s with a low double digit forward P/E multiple. That valuation assumed that the growth algorithm was broken; without new unit growth, how could The Home Depot deliver for shareholders? (“The stock did not do well… There were a lot of people who thought this wasn’t a great idea.”)
The chart below offers a compelling answer. Despite the fact that the store count has been largely unchanged, EPS increased at a ~20% CAGR from FY2010 (~$2.0) to FY2021 (~$15.5). The Home Depot has also paid a dividend, with an average payout ratio since FY2010 in excess of 40%.
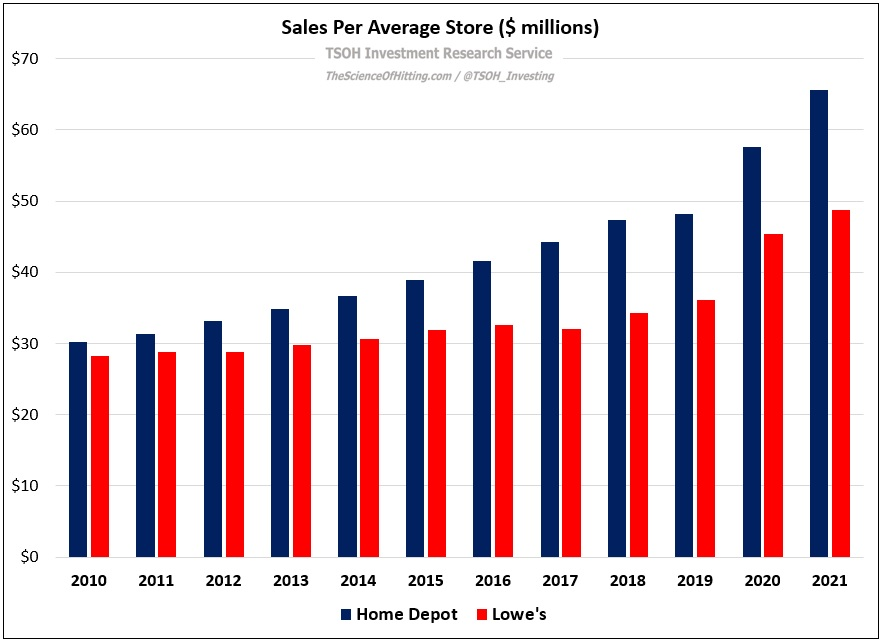
What explains this stellar outcome? The unit economics have greatly improved, with sales per store increasing by more than 100% from FY2010 (~$31 million) to FY2021 (~$66 million). In addition, operating margins have expanded by a few hundred basis points (from ~9% in FY2010 to ~15% in FY2021), along with a nearly 40% reduction in the share count and a lower tax rate. Investors who appreciated that the business could improve in other ways besides unit growth have been handsomely rewarded: at ~$321 per share, the stock has increased >10x from where it traded in early 2010.
Let’s spend more time digging in on HD’s performance over the past 10 – 15 years; not only is it instructive for thinking about the company’s strategy during that period, but it may be helpful in terms of understanding the effective execution that led to this compelling investment opportunity (a similar setup would likely be overlooked / underappreciated by Mr. Market).
The strategy over the past 10+ years has emphasized focus.
The company ended its International expansion (outside of North America), shuttered non-core formats like EXPO, and significantly curtailed new unit growth in the United States. Resources previously allocated elsewhere (money and managerial attention) were singularly focused on optimizing the core retail business – both in terms of defining the primary customer segments (DIY homeowners and Pros) and effectively serving those customers (for example, by making the technology and infrastructure investments required for omni-channel; ~50% of online orders are fulfilled through the stores – BOPIS, curbside pickup, etc. - which speaks to the importance of convenience and speed for many customer purchases).
It may sound simplistic, but The Home Depot became intensely focused on operational excellence in its core U.S. retail business - and customers noticed. (“It opened up resources to invest in things like supply chain and digital… How do you make the business more productive within the four walls of existing stores?”) In FY2021, the average Home Depot store completed ~2,100 customer transactions per day, which was up ~30% from the ~1,600 daily customer transactions reported back in FY2010. By comparison, the average number of daily transactions at the average Lowe’s store (HD’s primary competitor in the U.S.) increased ~12% over the same period, from ~1,250 in FY2010 to ~1,400 in FY2021. That gap largely explains why the average HD box generates annual revenues that are more than 30% higher than the average Lowe’s (~$66 million and ~$49 million, respectively).
A big part of the HD playbook has been focusing on the needs of Professional (“Pro”) customers - think handymen / tradesmen, GC’s, property managers, and so on. While Pro’s account for a relatively small percentage of the base (<10% of HD’s customers), they generate roughly half of its revenues (naturally, they spend significantly more throughout the year than your average DIY customer). For this customer base, HD offers a number of value-adds, including a dedicated salesforce, enhanced delivery options, a loyalty program, tool rentals, and commercial credit offerings. (2017 Investor Day: “With over 40% sales penetration, serving the Pro is important to our success… For the past several years, Pro sales have outpaced DIY with consistent double-digit comps. Our average Pro customer spends more than $6,000 per year.”) In the Pro business, much like in DIY, HD’s success has largely come down to effective blocking and tackling; competitive product pricing (which requires being an efficient, low-cost operator) and quality customer service is a proven model in retail. (“Your scorecard is sales and market share; if you bring the right value prop to the customer, you win.”)
In summary, The Home Depot has two customer segments that each account for roughly half of its revenues; the beauty of the model is that both customers are primarily served through a shared channel – HD stores.
As the numbers above show, HD generates meaningfully higher unit volumes than its primary competitor, which enables it to more effectively manage (spread) the costs associated with servicing customers (SG&A expense): on a roughly comparable level of gross margins, HD has consistently generated operating margins that are hundreds of basis points higher than Lowe’s.


