Convergence Calamity, Revisited
Note: Here are the links to prior TSOH research on CMCSA and LBRDA
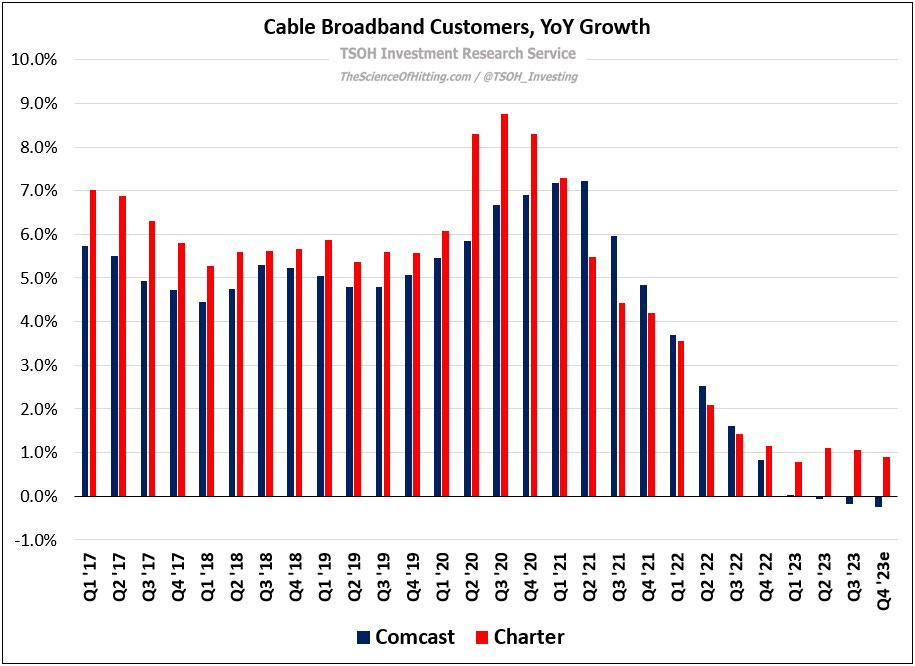
When 2021 came to a close, Comcast management could look back on the results of the prior decade with much to be delighted about. The broadband customer base had increased from 18.1 million in 2011 to 31.9 million in 2021 (+6% CAGR), with more than one million broadband net additions in every year during that period. While this result was helped by ongoing growth in homes and businesses passed - up 15% cumulative to 61 million - the larger factor was a significant increase in penetration (up from ~35% to ~53%).
That said, as the company looked ahead to 2022, it was already apparent that future growth was likely to be harder to come by; the combination of a significant pandemic-related pull forward of net adds, along with changes in the competitive landscape, suggested that the years ahead may look quite different relative to the results the company delivered over the prior decade.
In his opening remarks on Comcast’s Q4 FY21 call, CEO Brian Roberts said the following about the broadband business: “Within this environment, we will strike the right balance between subscriber acquisition - against a large and expanding addressable market - as well as long-term, profitable growth. We will evaluate every opportunity to increase our passings, even more so than we have in the past… We also will aggressively compete for market share through our strategy of bundling products around broadband, so that every customer in every segment has plenty of choice at the right price.”
As we approach the end of 2023, the scorecard for the past two years is a mixed bag. While Comcast and (especially) Charter have done a good job on wireless, they’ve faced real pressure of late in broadband. For example, Comcast’s Q4 FY23 guidance suggests that they’ll end the year with ~32.2 million broadband customers – down 0.3% from YE FY22; on broadband penetration, that implies a rate that’s ~100 basis points lower than yearend FY21. As opposed to the mid-single digit volume growth reported from 2011 to 2021, the question has quickly become whether Comcast can grow core broadband customers at all (excluding gains from RDOF and the like.)
Directionally, the story is similar at Charter. While their management team has slightly differing views on the balance between volumes and rates (ARPU’s) in broadband, they are also facing headwinds: it now looks like they will fall well short of their FY23 goal of surpassing FY22’s +344k broadband net adds. While ~1% customer growth for FY23e is ahead of a comparable -0.3% decline at Comcast, Charter is also making some financial sacrifices to deliver that result; whether that trade-off is worthwhile is an open question.
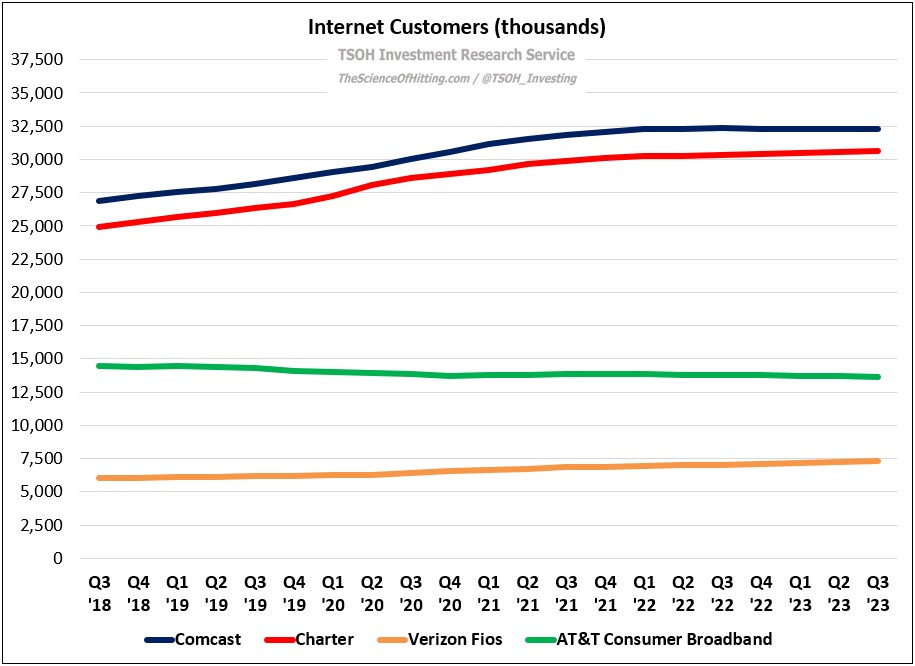
As we think about the cause of this shortfall, consider the following data for a few of the big names in the connectivity industry: Comcast, Charter, Verizon Fios, and AT&T Broadband. Five years ago (Q3 FY18), these companies had ~72.3 million internet customers. As of Q3 FY23, the total was ~83.9 million - with Comcast and Charter accounting for ~95% of the net adds. Even if we zoom in on the past 24 months, you’d still be hard pressed to conclude AT&T Broadband or Verizon Fios are the primary source of Cable’s problem.
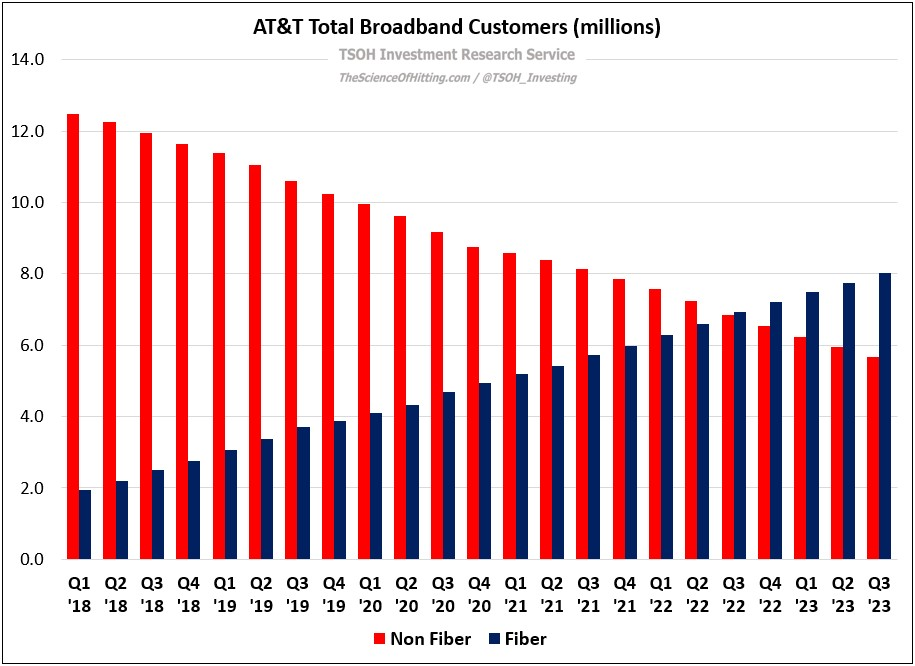
As you can see below for AT&T, that outcome reflects incessant pressure from the decline of their non-Fiber base. On a net basis, they have not been taking market share over the past five years. (Of course, if those two trends continue, the size of each bucket will be very different within 2-3 years.)
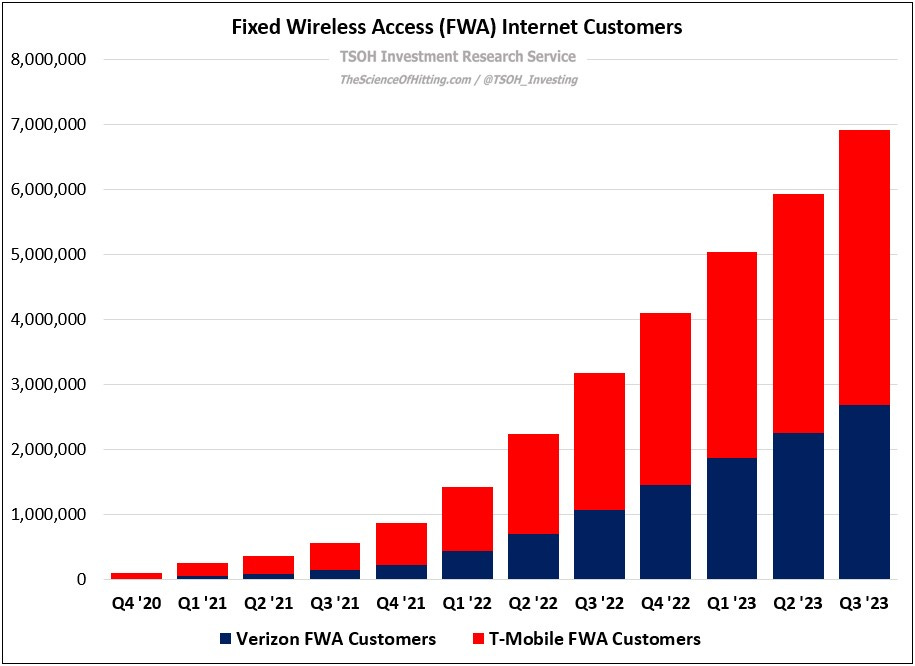
Contrast that with the results for another “competitor”: fixed wireless access, or FWA. As you can see below, Verizon and T-Mobile have collectively added nearly seven million FWA customers over the past three years (VZ FWA customers are not included in the Fios calculation). In addition, AT&T entered the FWA market in August 2023 with Internet Air, which quickly added ~25k customers. As noted on the company’s Q3 FY23 call, it will be a “targeted catch product” for copper / DSL customers (“typical download speeds between 40-140 Mbps”). It is available for $55 per month, or just $35 per month for AT&T customers with eligible wireless service; that compares to a non-Fiber monthly ARPU for AT&T Broadband in Q3 FY23 of $60 per month.
In summary, I think there’s reason to believe cable’s incremental net add headwinds are largely attributable to FWA, not Fiber. As we look ahead, I think two key questions need to be answered: (1) What are the competitive dynamics between FWA and Cable? (2) Is FWA a short-term phenomenon, or will it have a larger / longer lasting impact on U.S. household connectivity?
Competitive Dynamics


