The Berkshire Buyback Machine
Considering it’s my second largest position, a discussion on Berkshire Hathaway is overdue (the only time I’ve discussed it since launching the TSOH Investment Research service was the April 2021 Portfolio Review).
To start today’s write-up, let’s revisit what I wrote at that time:
“Berkshire Hathaway is a collection of wholly-owned businesses (subsidiaries) and investments that have been cobbled together by Warren Buffett and Charlie Munger over the past 56 years. Today, Berkshire’s value primarily resides in a handful of areas, including the property/casualty insurance operations (GEICO, reinsurance businesses, etc.), Class I railroad Burlington Northern Santa Fe, the utility and energy businesses within Berkshire Hathaway Energy (BHE), and publicly owned securities (most notably a ~$110 billion stake in Apple).
When valuing Berkshire, my approach is to look at the earnings of the operating businesses (BNSF, BHE, etc.), with a few adjustments to normalize the volatile line items (for example, insurance underwriting). On this basis, run rate earnings at Berkshire in 2020 were ~$26 billion, down from 2019 given COVID-related pressures throughout the year. Inclusive of the unreported retained earnings from Berkshire’s marketable securities holdings, after-tax normalized (look through) earnings were ~$32 billion in 2020, or ~$14 per Class B share (this does not include any premium for the optionality offered from excess cash balances).
Over the next 5 - 10 years, I expect Berkshire to increase normalized EPS and book value per share at a high single digit CAGR (at least), with a much lower probability of adverse outcomes than the average S&P 500 company over a similar time horizon. The position is a ballast in my portfolio, with capped upside (the days of compounding at ~20% p.a. are long gone) offset by limited downside risk (in terms of intrinsic value, not price action; with meaningful repurchases on the table, as evidenced by ~$25 billion of buybacks in 2020, shareholders should welcome lower prices in the short-term). During those inevitable tough stretches for the economy and markets, I expect management to utilize excess liquidity for acquisitions, repurchases, and other investments. No matter what lies ahead, I remain comfortable with the hand Berkshire holds, as well as with the short list of individuals likely to take charge after Buffett and Munger (As Munger said in 2019, ‘It’s amazing how good this next generation [Jain, Able, Combs, and Weschler] is, and they’re steeped in our non-bureaucratic ways.’)”
I will focus today’s write-up on three areas that I believe are pertinent to a continued investment in Berkshire Hathaway: (1) the underlying business results, with particular focus on GEICO and BNSF; (2) the capital allocation framework in recent years; and (3) my thoughts on Berkshire’s valuation.
Business Results: Insurance
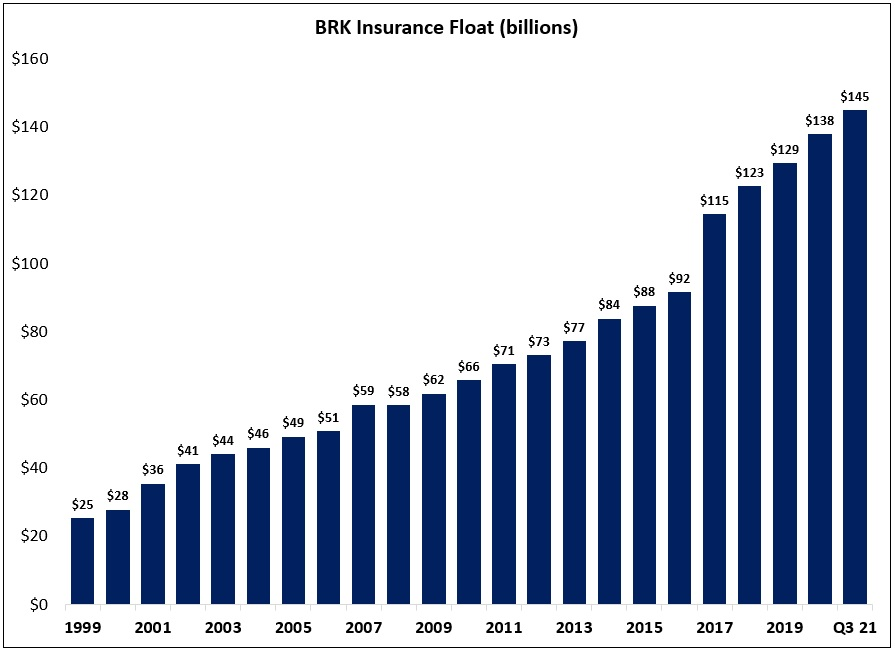
Through the first nine months of 2021, Berkshire’s operating earnings (which excludes the impact of unrealized gains or losses in the equities portfolio) increased by 19% to $20.2 billion; compared to the same period in 2019, operating earnings were up low-single digits. In Insurance, the YTD results have been a mixed bag; insurance float has continued to grow (+7% YoY to $145 billion), but profitable underwriting has been harder to come by.
I want to focus our attention on GEICO, where YTD pre-tax underwriting income has declined by ~$2 billion. Throughout 2020, when individuals were working remotely and driving infrequently during the heart of the pandemic, accident claims declined significantly (in Q2 FY20, loss & LAE expense was just 62% of earned premiums; note that much of this one-time benefit ultimately ended up back into the pockets of policyholders as a result of the GEICO Giveback program, which reduced premiums by ~$3 billion in 2020).
However, as noted in the 10-Q, that is no longer the case: “Starting in Q2 2021, average claims frequencies began to increase as driving by policyholders increased. In addition, average property claims severities increased due to the increase in the valuation of used vehicles.”
The net result has been a meaningful increase in loss & LAE expenses as a percentage of earned premium (up 800 basis points YoY to 80% despite a $1.2 billion benefit from a reduction in prior years’ claim loss estimates), offset by a slight improvement on underwriting expenses. As you can see below, 2020 was an outlier – the results in 2021 are roughly in-line with what GEICO reported over the past decade, when the combined ratio averaged ~96%.
Year to date, GEICO has added 159,000 voluntary auto policies in force (PIF’s), well below the pace of volume growth over the past five years (+935,000 per year). In addition, they’ve lagged best-in-class competitor Progressive by a wide margin (PGR has added 1.1 million net auto PIF’s through the first nine months of 2021). As you can see below, this isn’t a new development: over the past five years, PGR has outgrown GEICO by a wide margin. Much like in the railroad business, which I’ll discuss in a moment, I think shareholders need to honestly ask themselves whether GEICO – which is widely considered a crown jewel among Berkshire’s subsidiaries – has lived up to its reputation as of late. (Ajit Jain at the 2021 shareholder meeting: “About a year ago, Progressive had margins that were almost twice as high as GEICO's, and a growth rate that was almost twice as much as GEICO’s… Hopefully that gap will be nonexistent in the future.”)


