Meta: The Next Peak
Beginning with the Q4 FY22 figures, a close study of Meta’s financial results presented compelling evidence that significant change was underway in the company’s cost structure (and, during the early days of those developments, without an overwhelming response from Mr. Market). That continued into Q3 FY23, with Meta posting adjusted consolidated EBIT margins of 41% – it’s best result in more than two years. That outcome reflects the impact of Meta’s “Year of Efficiency”, as well as a return to impressive revenue growth.
For a company that has experienced some wild swings in its stock price over the past two years, let’s take a moment to level set Meta’s current position.
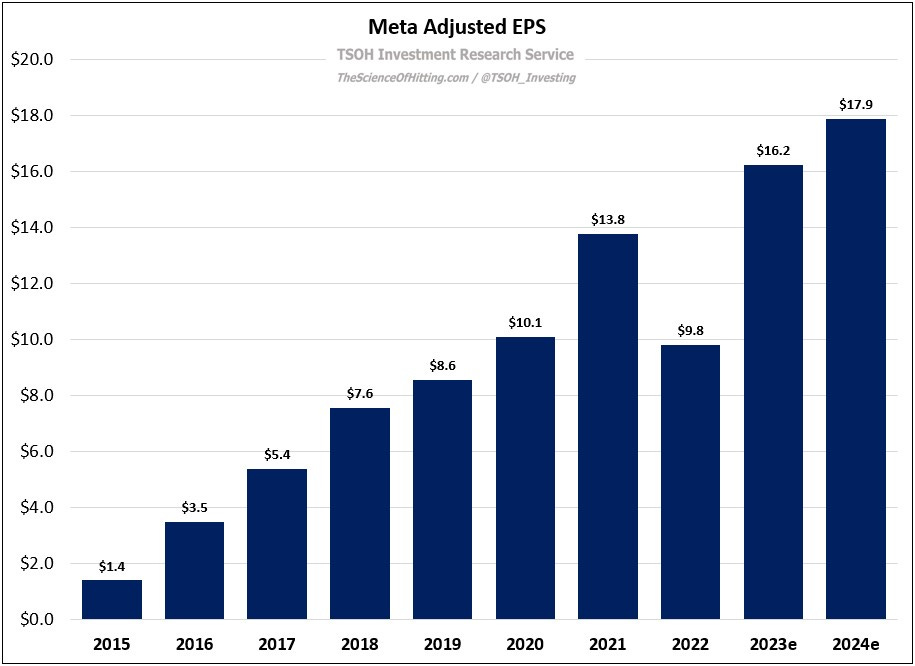
As of Q3 FY23, there are ~3.14 billion people globally who use at least one of their services (apps) on a daily basis – an increase of more than one billion people over the past five years (inclusive of continued growth for Facebook). Based on guidance, FY23e revenues will be ~$133 billion – with a trailing five-year revenue CAGR of ~19%. Finally, despite significant ongoing losses in Reality Labs (FRL), Meta is likely to report record non-GAAP EPS in FY23.
Long story short, despite an endless list of concerns in recent years - such as ATT, TikTok, fears of the namesake app’s demise, FRL losses, and the huge OpEx / CapEx ramps, to name a few - Meta has emerged with an enviable hand. As we approach what may be another period of discomfort for some market participants - more on the FY24 OpEx guidance and FRL below - it’s useful to take note of how this last bout of (intense) uneasiness played out.
(Some interesting numbers: at the bottom tick in November 2022, Meta had an enterprise value of ~$200 billion. With the benefit of hindsight, it traded at ~3x FY24e FOA EBIT. Even if you tack on -$100 billion for FRL, it traded at ~5x FY24e FOA EBIT. Put differently, despite a >3x increase for the stock from the lows, it trades at a mid-teens multiple of FY24e EPS. Needless to say, the narrative and realities of the business at that time were quite dire.)
FOA Segment
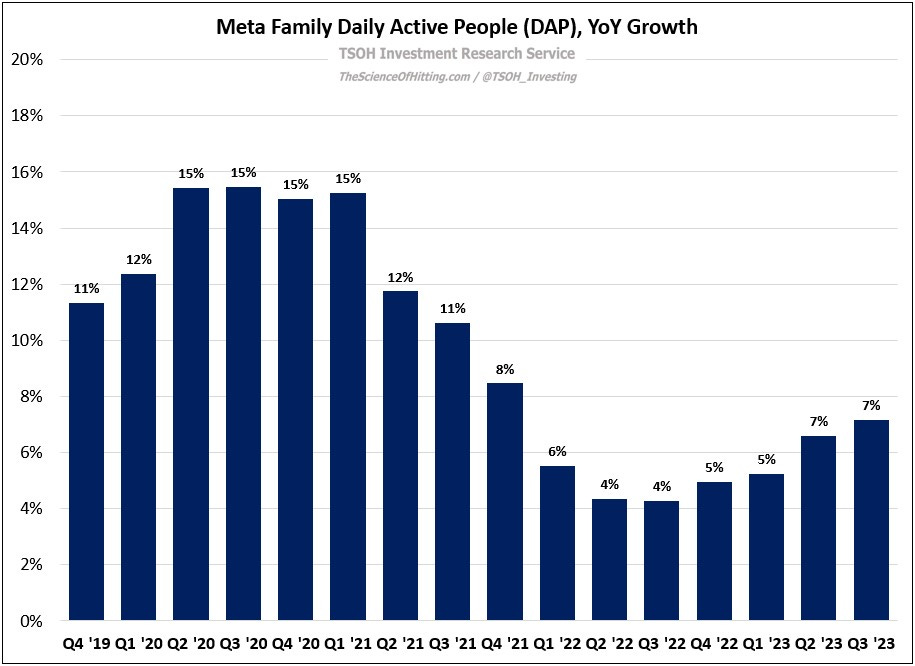
There are three key inputs on the top-line for Meta’s Family Of Apps (FOA) segment: (1) total engagement, which is the combination of daily active users (DAU’s) and per user engagement; (2) ad loads; and (3) ad pricing, which is tied to supply / demand and returns on ad spend (ROAS). On the first point, Meta continues to impress: despite a massive DAU base that now exceeds three billion people, the number of (de-duplicated) Family DAU’s grew 7% YoY in Q3 FY23, the best result in six quarters. In addition, as has been the case in prior periods, management’s commentary continues to indicate new formats (Reels) and AI recommendation advances have improved time spent.
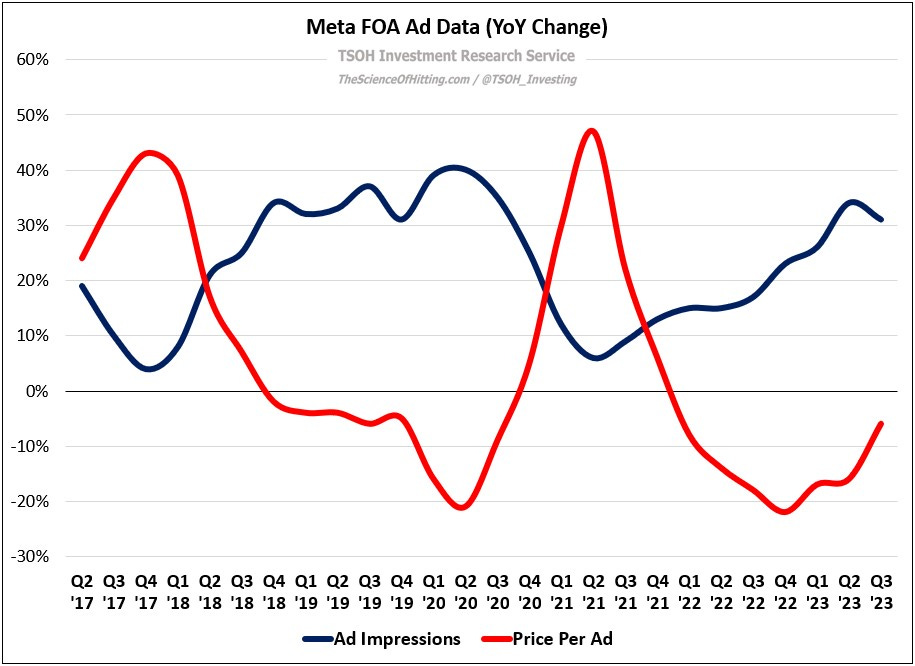
On ad loads and monetization, DAU growth and engagement drove a large increase in ad impressions (+31% YoY). In addition, despite the headwinds from geographic mix shift (outsized growth from lower ARPU regions) and time shift to lower monetizing surfaces, price per ad only declined by 6% YoY. This result was helped by products like Advantage+ that have mitigated the ATT / IDFA pressures on ROAS (“our ongoing improvements to ad targeting and measurement are continuing to drive improved results for advertisers”).
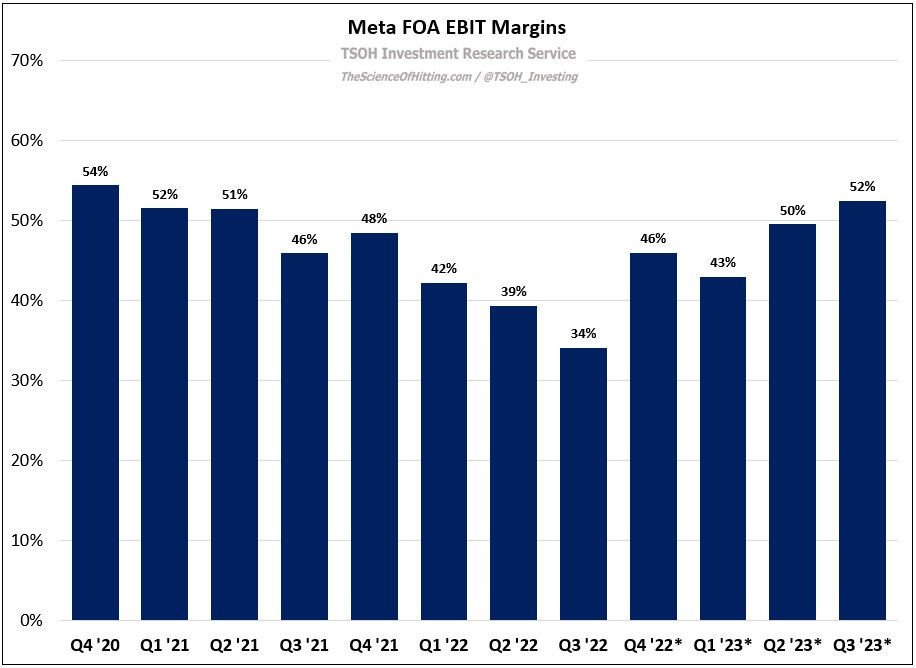
The above factors drove more than 20% YoY growth in FOA revenues; in combination with tight expense control, this led to a nearly 2x increase in FOA operating income, with segment margins climbing ~1,800 basis points in the quarter, to 52%. (With the benefit of hindsight, my response following the Q4 FY22 results - when it first became apparent that significant moves were underway - was inadequate. I should’ve acted when the facts changed.)
FRL Segment


