HD: "A Unique Environment"
From “Intense Focus” (December 2022 Home Depot deep dive):
“A big question on [Home Depot] is whether the pandemic-related gains are sustainable; will the significant step-up in per store sales achieved in FY2020 and FY2021 hold?... On that topic, here’s what CEO Ted Decker said about the state of the industry on the Q3 call: ‘We are navigating a unique environment; we can't predict how the evolving macro backdrop will impact our customer… Despite near-term uncertainties, the long-term underpinnings of demand for home improvement remains strong, and we are well positioned to leverage our distinct competitive advantages to capitalize on compelling growth opportunities in our space.’”
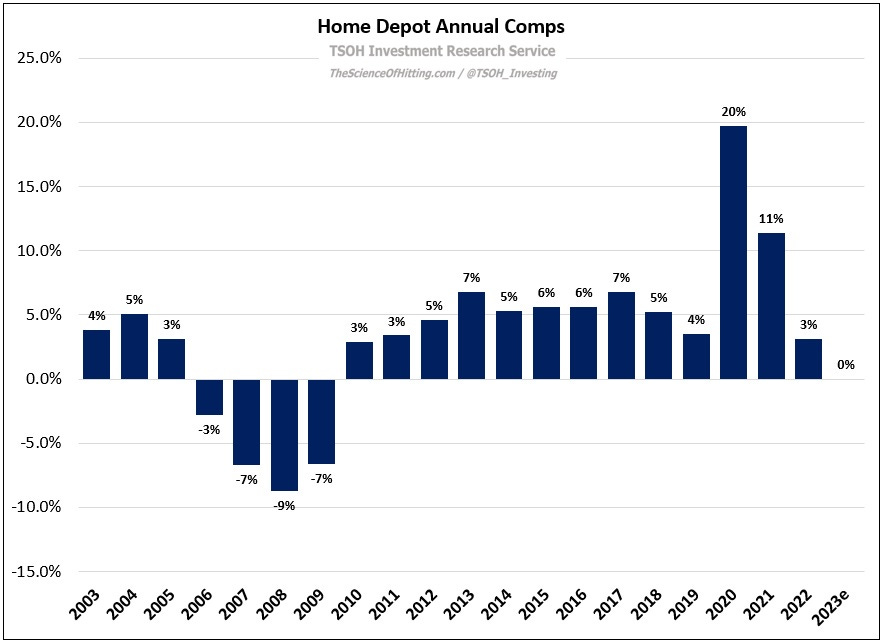
Last week, Home Depot reported its Q4 FY22 results; YoY comps declined marginally in the period, dragging FY22 same store sales growth to +3%.
Following the strong double digit comps reported in 2020 and 2021, the business reverted to a more normal result this year. The FY23 guidance, which assumes revenues will be flat YoY with EPS down mid-single digits, is indicative of the evolving macro backdrop Decker spoke about in Q3. The question now is whether FY23 is a base for The Home Depot to build off of (assuming they hit the guide), or if there’s another shoe to drop at HD.
For the year, Home Depot generated revenues of $157.4 billion (+4%). Compared to pre-pandemic levels (FY19), HD’s top-line has increased by more than 40% - an incremental $47 billion of annual sales, with a trailing three-year CAGR of +13% (to put that in context, the revenue CAGR from FY16 – FY19 was +5%); clearly, this has been a fortuitous period.
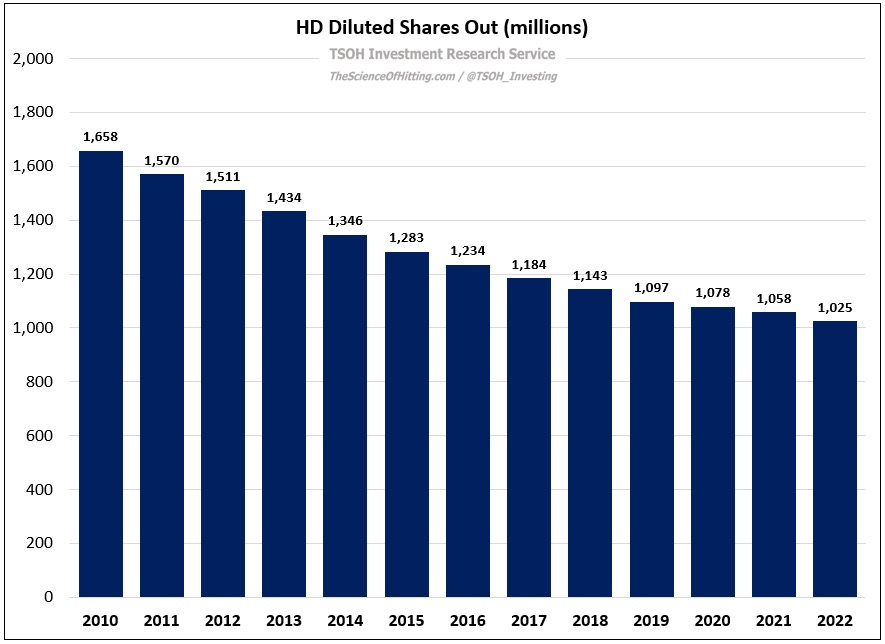
That benefit also flowed through the P&L, most notably in terms of operating expense leverage (a continuation of the long-term trend at HD). Operating margins hit 15.3% in FY22, the highest level in the company’s history. Along with the significant impact of ongoing repurchases, FY22 EPS was $16.7 per share – up more than 60% from the $10.2 per share earned in FY19.
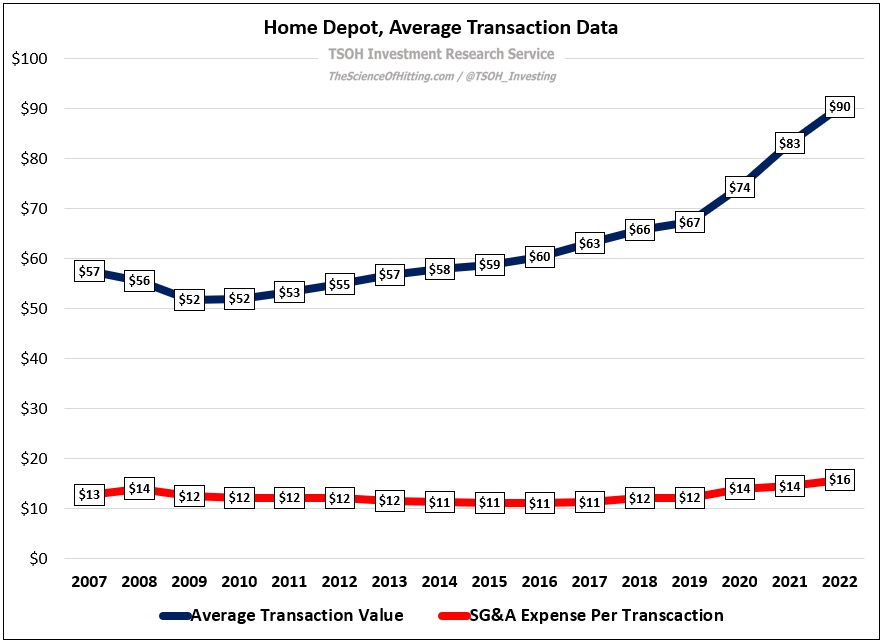
As we think about the composition of revenue growth, it’s important to note that volumes increased low-single digits cumulatively from FY19 – FY22. The overwhelming driver has been ticket, which reached ~$90 in FY22.
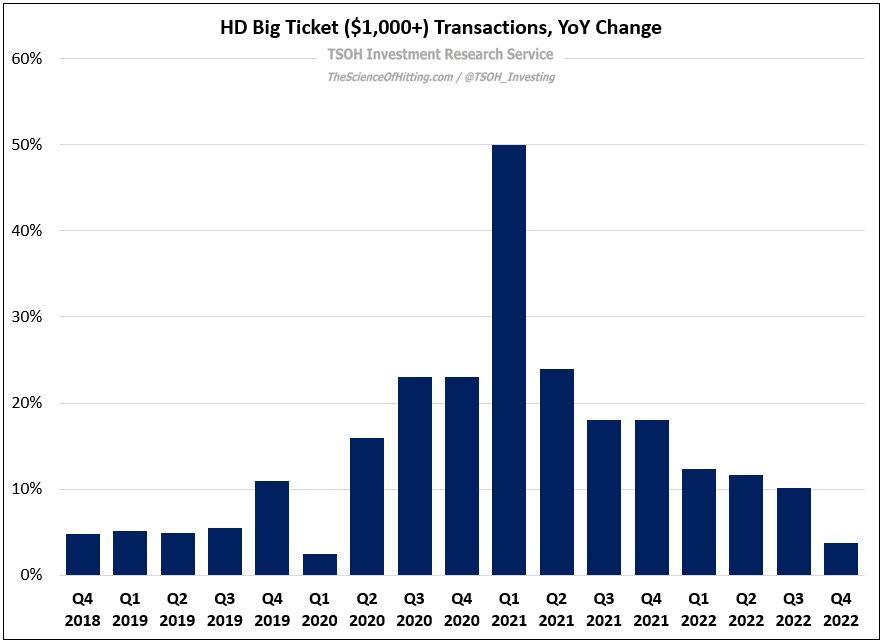
What explains the ticket (average transaction value) strength? If we look over the past three years (Q4 FY20, Q4 FY21, and Q4 FY22, for the sake of comparability), we can narrow it down to a few key variables. Back in Q4 FY20 (when comp average ticket was +11% YoY), the primary drivers discussed on the call were strong project demand and trade-up (customers purchasing products with higher ASP’s). While the contribution of those buckets seems to have lessened more recently, note that the number of $1,000+ “big ticket” transactions was still up 4% YoY in Q4 FY22 (continued traction with Pro customers); it has decelerated significantly from prior quarters, but it continues to outpace consolidated comps. (These $1,000+ “big ticket” transactions account for roughly 25% of Home Depot’s sales.)
(Tegus interview, former HD senior director: “What HD has historically seen in times when the economy has not been as robust is that people will maybe put off doing the dream kitchen or dream bathroom project, but they're still going to maintain their home… Bigger ticket items might not be purchased, but people will find other ways to spruce things up; it can just be as simple as a paint job or changing the drawer pulls on your cabinets.”)


