"We Went Where They Ain't"
A deep dive on Dollar General
As a follow-up to last week’s Dollar Tree write-up, let’s look at the company that was (quite luckily for them) the runner-up on the Family Dollar deal.
Dollar General, a discount retailer with more than 17,000 stores in 46 states throughout the U.S., operates a straightforward business model: “Provide a broad base of customers with their basic everyday and household needs, supplemented with a variety of general merchandise items, at low prices in conveniently located, small-box stores.”
The importance of “conveniently located, small-box stores” cannot be overstated. A major part of DG’s success has been attributable to its small town focus. As noted in the annual report, roughly 75% of DG’s stores are in towns with less than 20,000 people. These are the kind of places where the economics may justify an 8,500 square foot DG box, but not a 180,000 square foot Walmart Supercenter. Finding pockets throughout the country where DG can effectively serve its customers, in those places where big box retailers cannot, has been a key part of the company’s real estate strategy for many years; as David Perdue, the CEO of Dollar General from 2003 to 2007, once put it, “We went where they ain’t”.
For the people living in these towns, Dollar General is a great solution for their day-to-day shopping needs - and one that becomes even better over time as initiatives like NCI and DG Fresh, along with store remodels to add coolers for refrigerated and frozen foods, improve DG’s supply chain and merchandising capabilities. Customers can quickly pop in and get what they need at good prices, particularly relative to what they pay at a C-store or a local mom & pop (“most shoppers stop by a few times a week for a handful of items they need that day”).
The business mix reflects this focus on price and convenience: nearly 80% of DG’s sales are attributable to consumables like toilet paper, frozen pizza, toothpaste, and beer (as noted at the 2016 Investor Day, sub-$5 products account for ~75% of DG’s sales, with an average transaction value of ~$11). Dollar General competes - and wins - by delivering a balance of value AND convenience to small town America (“succeed in small markets with limited shopping alternatives”).
The success of the company’s business strategy is evident in the numbers: as shown below, Dollar General has reported same store sales (SSS) growth in each of the past 31 years, with sales per average store increasing from ~$500,000 in FY1990 to ~$2 million in FY2020 (as it relates to SSS, note that new stores typically generate year one volumes of about $1.4 million, which provides a tailwind to comps as new units mature in months 14 and beyond).
In addition, the company has expanded its footprint: over the past decade, the store count has increased at a ~6% CAGR (net increase of 7,800 stores).
In fiscal 2021, the company will continue to widen its reach, with the addition of more than 1,050 new stores (inclusive of 50 pOpshelf format stores); the company also expects to remodel 1,750 stores and relocate another 100 stores, for a total of 2,900 real estate projects during the year (the company looks to remodel or relocate stores on a seven-year cycle).
The economics of an incremental box are very attractive: the average DG, which requires about $250,000 in new store investment for leasehold improvements, fixtures and equipment, generated about $150,000 in operating income in FY19 (payback period of less than two years).
In addition, given the resilient nature of the business - as mentioned earlier, decades of SSS growth, including strong comps during periods like the GFC in 2008 and 2009 - management has rightly operated the business with some leverage (target of 3x adjusted debt to EBITDAR). They’ve also been able to do so at attractive rates, with April 2020 debt issuances ($1.0B of 10-year notes and $500M of 30-year notes) at a blended interest rate of less than 4%.
Here’s the net result: from FY15 – FY19, (excluded FY20 to back out the pandemic tailwind) revenues increased at a ~8% CAGR (attributable to low-single digit annualized comps and mid-single digit annualized unit growth), net income increased at a ~10% CAGR (delta to revenues from higher net margins on a lower tax rate), and EPS increased at a ~14% CAGR ($5.2 billion in cumulative repurchases at an average cost of $94 per share).
2020 took those solid results up another notch. For the year, revenues increased 22% to $33.8 billion, with SSS up 16%. Gross margins and SG&A expense (as a % of sales) both improved by more than 100 basis points, resulting in meaningful EBIT margin expansion, to 10.5% (adjusted operating profits were up more than 50% to $3.55 billion). After accounting for a 3% reduction in the share count ($2.5 billion of repurchases at an average cost of $200 per share), adjusted EPS increased 58% to $10.6 per share.
Naturally, some of the FY20 lift will fade as we move through FY21. But impressively, as outlined in the updated guidance following Q1 results, a large percentage of the gains are expected to hold. DG management expects FY21 revenues to be roughly flat to FY20, with mid-single digit unit growth offset by a 3% - 5% decline in comps. Notably, that outcome would still result in a two-year stack of roughly +12%, ahead of the roughly +7% two-year stack reported throughout FY19.
For the year, management has guided to diluted EPS of $9.5 - $10.2 per share. At the mid-point, 2021 EPS would be down high-single digits from 2020 – but over the past two years (2019 – 2021e), that’s a compounded annual growth rate of more than 20%. Assuming 2021 represents a return to normal (a base to build from), COVID has been a net benefit for DG.
Valuation
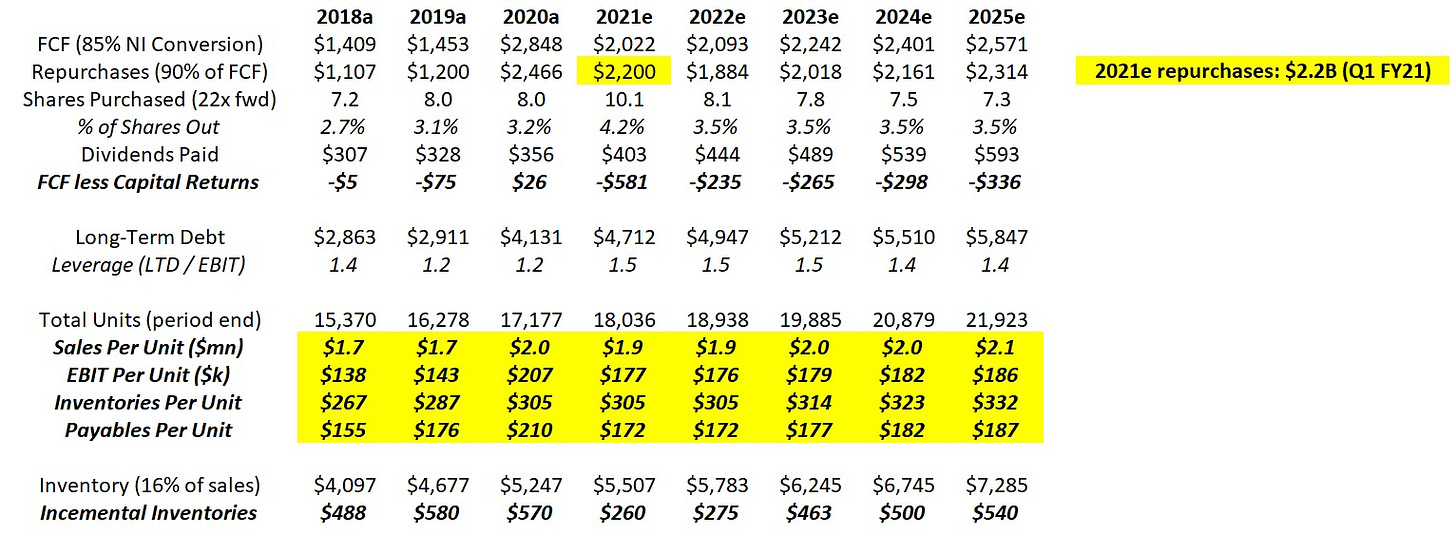
As shown below, I assume FY21 results in-line with guidance (~flat sales and a mid-single digit decline in EPS). In FY22, I've modeled a short-term headwind to sales growth due to difficult comparisons (the outsized two-year stack discussed above) and as the tailwind to consumer spending from government stimulus dissipates. In addition, I assume a lag on profit growth such that EBIT margins trend closer to their pre-pandemic levels (also builds in some cover in case the company experiences higher than expected COGS or labor costs). In the out years (FY23 – FY25), the business returns to high-single digit revenue growth, driven by a combination of SSS and units. Finally, I assume 90% of FCF is used to fund repurchases, with the share count declining 3.4% per annum through FY25 (by comparison, the share count declined 3.3% p.a. in the five-year period through FY20).
All-in, I believe FY25e earnings will be around $14.5 per share. As shown below, that compares to FY15 EPS of $3.9 per share, which works out to a trailing 10-year diluted EPS CAGR of ~14%.
Conclusion
My biggest concern with DG is the long-term sustainability of unit growth. As noted earlier, the company added 780 net new locations per year, on average, over the past decade, or more two new stores every single day. For how long can this breakneck pace possibly go on?
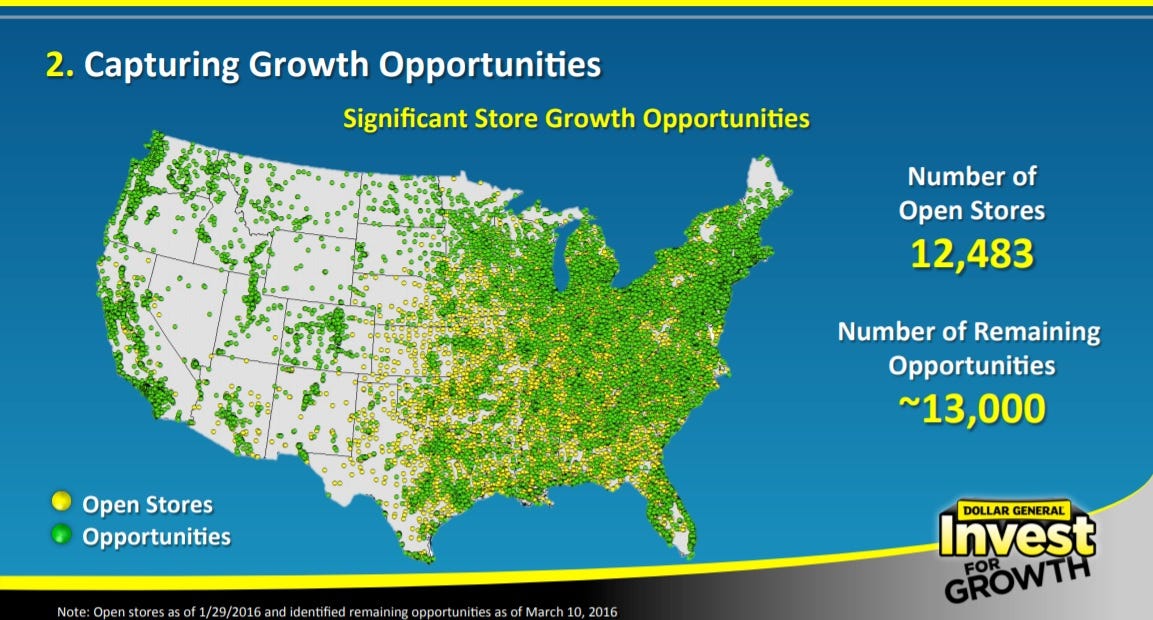
As shown below, management estimated at the 2016 Investor Day that there was an opportunity for ~25,500 Dollar General stores in the United States over the long run. From an ending count in Q1 FY21 of 17,426 stores, that leaves room for another 8,000 locations. Assuming 5% annualized unit growth, DG will reach 25,500 stores in about eight years.
Let’s assume that’s still an accurate estimate of the TAM.
How valuable is Dollar General under that scenario?
Here are a few assumptions for FY28: (1) Ending store count of 25,500 units; (2) Sales per store of $2.3 million; (3) EBIT margins of 8.5%; (4) $250 million in net interest expense and a 22% tax rate; and (5) A diluted share count of 180 million shares, or -3.5% p.a. from the Q1 FY21 share count (240.3 million). On those numbers, the business would earn ~$20 per share in FY28 (for context, that’s an ~11% CAGR from the midpoint of 2021e).
What would its value be at that point in time?
Given the company’s sustainable competitive advantages, I would expect those stores to generate strong results for many years. For that reason, I think you could view those ~25,500 stores as the equivalent of a high-quality, long-term bond. If DG traded at a 7% yield on roughly $20 of earnings, the stock would be at $280 per share in FY28 (they will also pay about $20 in per share dividends from 2021e – 2028e, so $300 of per share value).
That scenario, which I think is overly pessimistic, would still result in TSR’s of ~4.6% per annum. Obviously, that isn’t a great return - but it strikes me as reasonable for a bad outcome. (Note that the repurchase assumption to get to ~$20 in FY28e EPS implies that the buybacks would be completed at something close to the current multiple of ~20x forward, as opposed to the 7% yield – or 14x forward earnings multiple – I’m using above).
In summary, I believe Mr. Market has some doubts about the company’s ability to grow beyond ~25,500 units and / or questions the sustainability of the business and its economics at maturity. I’d argue the market has held some version of this belief for much of the past five years, which is why the stock trades at a pretty large discount to retailers like Costco. Personally, I think that conclusion has been, and continues to be, too pessimistic.
For that reason, I will make DG a 5% position tomorrow morning.
Why 5%? As outlined in the April 2021 Portfolio Review, that’s a self-imposed minimum for me. But why not make it larger? Besides a more compelling valuation, the other thing I’d like to have is clarity on life beyond 25,500 stores. For example, management is optimistic about the opportunity for concepts like pOpshelf and DGX; will those banners add thousands of stores over the next decade? (As noted on the Q1 FY21 call, management believes there’s runway for 3,000 pOpshelf stores and 1,000 DGX stores in the United States.) In addition, management has updated their guidance from the 2016 Investor Day, calling for more than 30,000 DG’s (Q1 FY21 call: “traditional fleet… we believe there's 13,000 additional opportunities”). How realistic is that updated TAM estimate? And if the low hanging fruit has been picked, will the unit economics / ROI’s hold up?
Over time, if I become more confident in the answer to these questions or if the equity trades at a more compelling valuation, I will likely make DG a (much) larger position.
NOTE - This is not investment advice. Do your own due diligence. I make no representation, warranty or undertaking, express or implied, as to the accuracy, reliability, completeness, or reasonableness of the information contained in this report. Any assumptions, opinions and estimates expressed in this report constitute my judgment as of the date thereof and is subject to change without notice. Any projections contained in the report are based on a number of assumptions as to market conditions. There is no guarantee that projected outcomes will be achieved. The TSOH Investment Research Service is not acting as your financial advisor or in any fiduciary capacity.


