"Turbocharged"
“It was on July 17, 1955, that Walt Disney unveiled something called Disneyland. No one had ever seen anything quite like it, and it created an entirely new category of entertainment, called the ‘theme park’. It also transformed this Company and proved in an incredibly dramatic way how great creative content can lead to other great creative content. Suddenly, there was a place where people could meet Mickey Mouse, could fly with Peter Pan, and could visit Davy Crockett’s wilderness frontier. Disneyland, in turn, led to even more creative success and growth with Walt Disney World, Tokyo Disney Resort, Disneyland Resort Paris, and Hong Kong Disneyland.”
That’s a quote from Disney’s 2004 annual report. While that year marked the beginning of a rebound for the Parks & Resorts business, it was preceded by a difficult stretch following the terrorist attacks of September 11th, 2001, along with broader U.S. macroeconomic pressures. (“The impact on Disney’s business was devastating… Our stock lost nearly a quarter of its value within days of the attacks.”) Compared to the ~$2.0 billion of operating income that Disney’s Parks & Resorts segment generated in 2000 (inclusive of Consumer Products to align with the current reporting structure for Disney’s Parks, Experiences, and Products segment, or DPEP), profitability had fallen by more than 30%, to ~$1.3 billion, in 2003. That development coincided with a reduction in segment CapEx, which was down to ~$600 million in 2003 – a decline of ~60% from the ~$1.6 billion that had been spent in 2000 (with that number reflecting investments prior to the opening of California Adventure and Tokyo DisneySea). As then CEO Michael Eisner wrote in the company’s 2003 annual report, his expectation was that this general trend would continue in the years ahead: “In 2003, we were able to reduce our capital expenditures from the levels of the previous five years. This will continue to be the case going forward, which should result in increased free cash flow.”
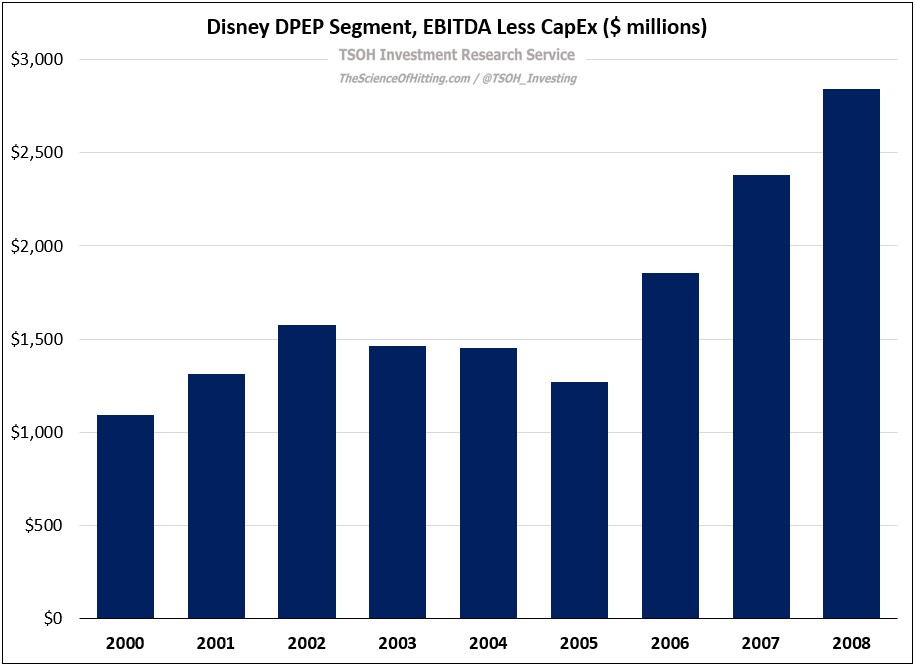
That prediction played out over the next five years, with average annual CapEx from 2004 to 2008 of ~$1.2 billion, or a few hundred million dollars less than what the company was spending at the turn of the century. With segment EBITDA less CapEx nearly doubling from 2003 to 2008, DPEP delivered on Eisner’s promise of increased free cash flow. (For our purposes, I’ll use EBITDA less segment CapEx as a proxy for DPEP free cash flow).


