BJ's Wholesale Club: Transformation?
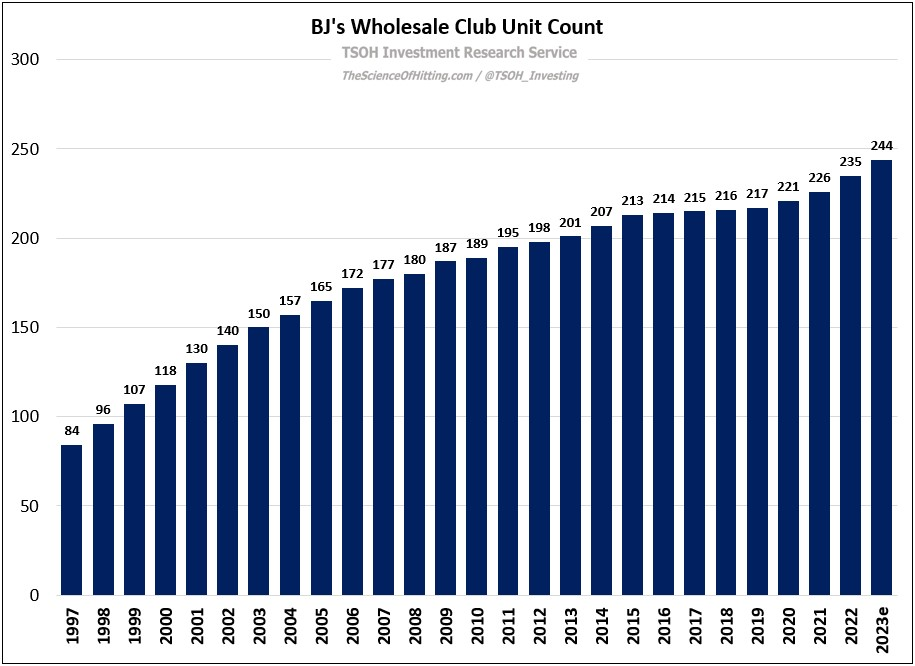
In June 2011, after 14 years as a public company, BJ’s Wholesale Club agreed to sell itself to two PE firms (Leonard Green & Partners and CVC Capital Partners), in a deal that valued the chain at ~$2.8 billion. At the time, some analysts argued the move would give the wholesale club the room to “accept earnings dilution, while preparing a national rollout beyond its core markets”. If the goal was significant unit expansion, the subsequent record has underwhelmed: BJ’s will end 2023 with 244 warehouses in 20 states, roughly 20% higher than its tally a decade earlier; as you can see below, that reflects a meaningful slowdown from the pace of unit growth reported at BJ’s over the prior 10-15 years, particularly during the late 1990’s / early 2000’s.
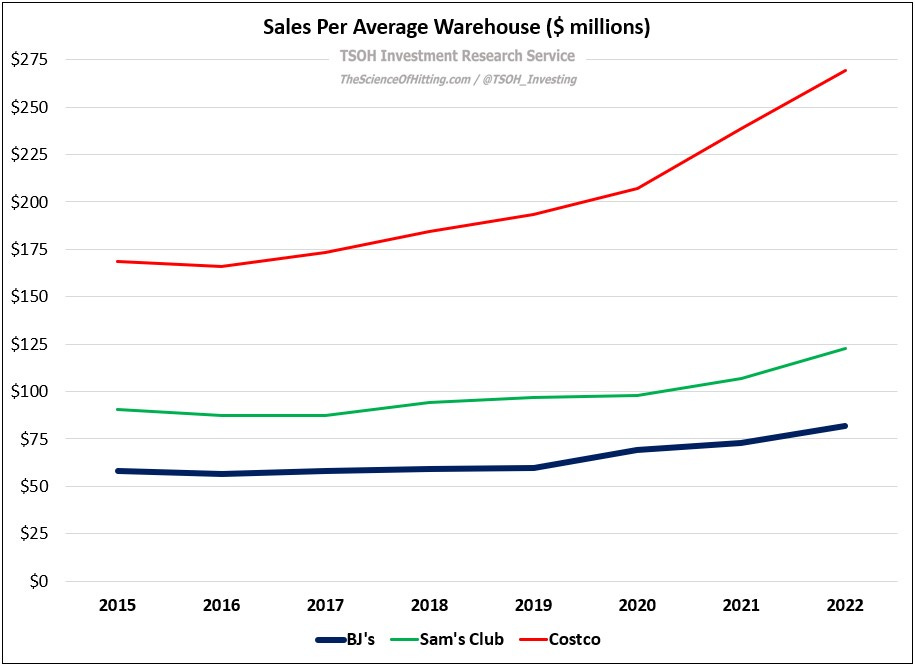
While it’s difficult to pinpoint a definitive explanation given some data gaps (limited historic financials in the S-1), I think one plausible answer is that stabilizing the core became a higher priority throughout the 2010’s. Here’s one data point to explain why: from 2008 – 2018, the sales volume per average BJ’s warehouse increased by ~8% (cumulative). Over the same period, average unit volumes at Sam’s Club and Costco increased by ~24% and ~35%, respectively. My sense is BJ’s largely muddled along throughout the 2010’s, with its PE owners taking the chain public once again in June 2018 (it jumped >25% on the first day, to a market cap of ~$2.7 billion; as of the most recent proxy, neither of the PE firms own >5% of the company).
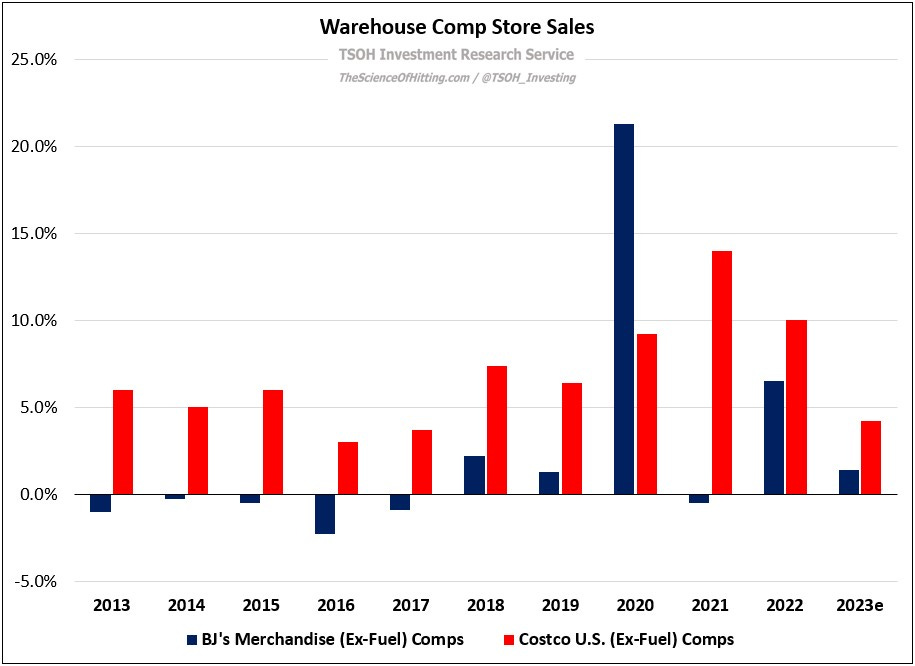
Then the pandemic happened: in 2020, BJ’s merchandise comps were +21%. Following a decent run in 2021 and 2022, with two-year stacked comps at +6%, the average BJ’s warehouse generated total 2022 sales (including gas) of roughly $82 million – up nearly 40% versus 2019, and higher than the cumulative percentage gain over the prior 15 years (2004 - 2019). In combination with EBIT margin expansion, this led to FY22 adjusted operating income of $765 million, up ~110% versus FY19. The stock price, from ~$22 at the end of 2019, has roughly tripled over the past four years. (Relative to FY23e adjusted EPS of ~$3.9 per share, BJ’s trades at ~17x.)
As we look back on what has transpired at BJ’s over the past 5-10 years, here’s the key question that I think a potential investor must answer: has something fundamentally changed at BJ’s as result of its transformation efforts, or does pandemic-related strength mask a tough long-term hand?
Competitive Dynamics and Financials
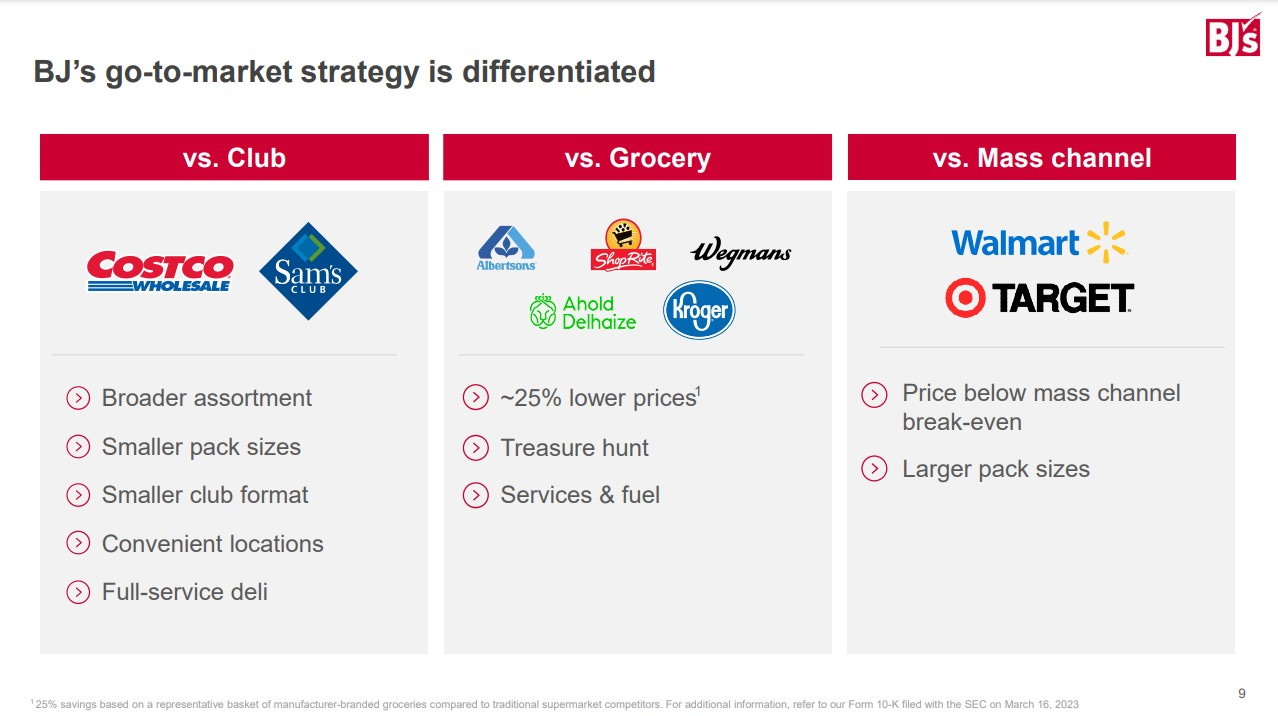
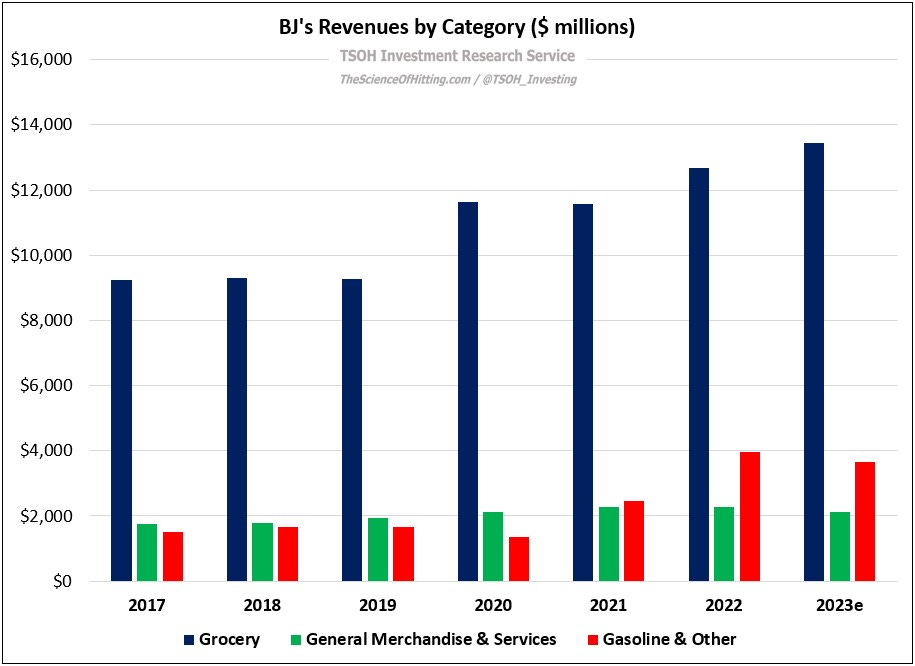
As we think about BJ’s competitive position and customer value proposition, note that its sales mix is heavily weighted towards grocery (~85% of FY22 merchandise sales). Relative to other warehouse operators like Costco and Sam’s Club, BJ’s offers smaller pack sizes and a broader merchandise assortment (“~2x SKU’s of club competitors… customers can fully supplant their grocery shopping at BJ’s”). That said, it’s also clear that BJ’s lags in its non-discretionary / general merchandise (GM) category mix: the average BJ’s generates ~$10 million in GM sales per year (everything besides food and gas / ancillary); by comparison, the average Costco produces ~$70 million in per warehouse sales annually from its non-food categories. Clearly, stronger results are needed here, with CEO Bob Eddy bluntly stating on the Q3 FY23 call that BJ’s customers “are not used to us having great assortments in general merchandise”. Given that BJ’s has reported -11% YTD GM comps through Q3 FY23, there’s a long way to go to live up to the vision shared at Investor Day. (Eddy: “Frankly, we have not been as successful in [GM]… Our GM transformation is a crucial part of our long-term growth strategy.”) To put these recent results in context, note that Costco’s FY23 non-food sales were roughly flat, which implies category comps declined low-single digits.
More broadly, as noted in BJ’s 2022 shareholder letter, the company is focused on improving merchandising across a few key areas, including a strengthened fresh offering, simplified grocery / sundries to optimize the assortment, and a better treasure hunt experience in GM. I’d paraphrase that by saying they want to improve in three areas that Costco does a very good job at. That said, part of the reason why Costco continually does so well at these things is because of certain self-imposed limitations, like larger pack sizes and a narrower assortment (fewer SKU’s). If BJ’s can thread that needle, I think it would be quite beneficial for their business. Slide 47 from Investor Day is a good example of what this looks like in action: BJ’s has pushed through meaningful SKU reductions across its health and beauty categories, which has resulted in benefits like operational efficiency, bargaining power with suppliers, and a cleaner presentation to members.
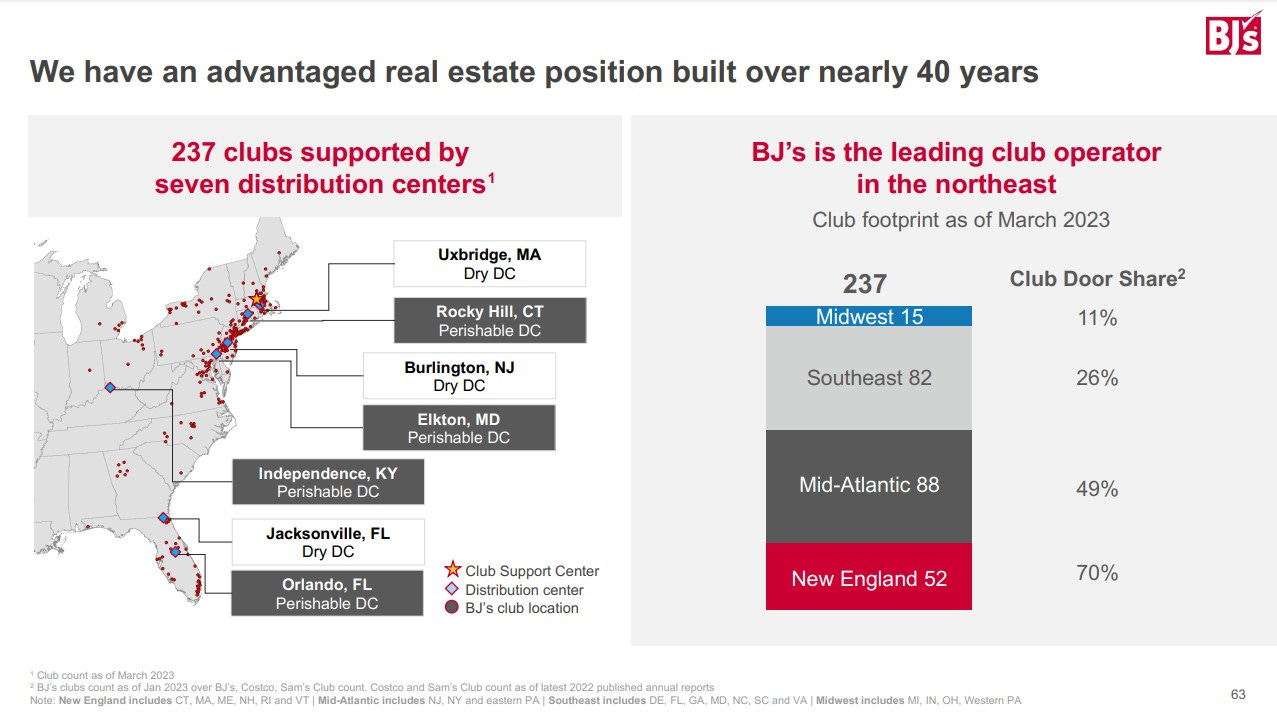
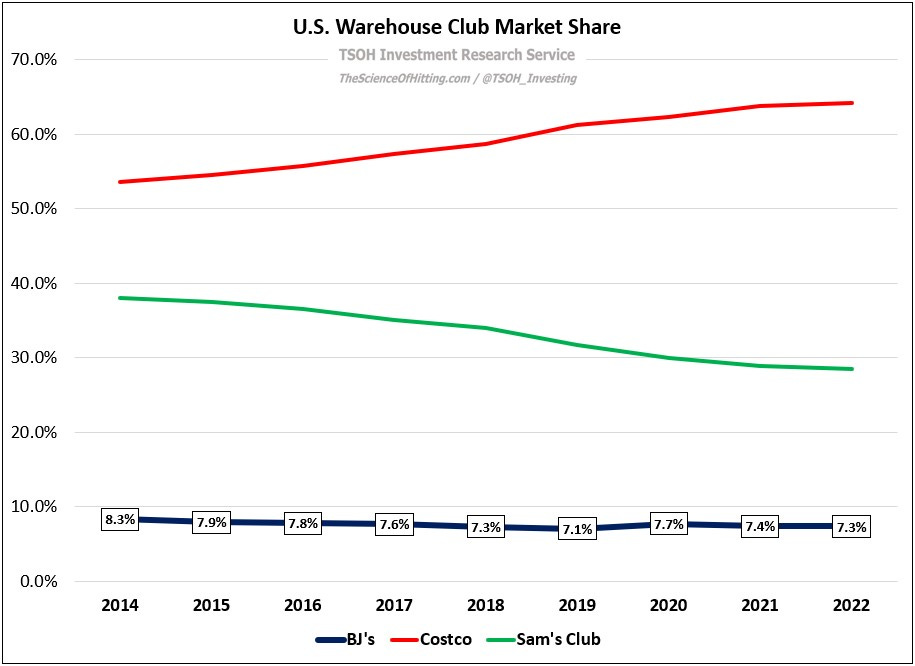
The good news for BJ’s is that Costco isn’t their only competitor (each has a somewhat unique geographic focus, with BJ’s having outsized exposure to the east coast, and especially the Northeast). While the market share data shown below indicates BJ’s hasn’t improved its position within the nearly $300 billion U.S. warehouse club category over the past decade, they’ve still benefited from broader category tailwinds; as Eddy noted at Investor Day, the warehouse club industry has grown revenues at ~11% per annum over the past five years, outpacing U.S. retail sales (+8% p.a.) and grocery (+6% p.a.).
BJ’s value proposition is primarily focused on Consumables / Food & Beverage at attractive prices (with even better value available to members with BJ’s co-branded credit card). Per management, BJ’s consistently offers savings of 25% or more on a basket of 100 popular manufacturer-branded groceries versus supermarkets. That said, the methodology for the savings calculation – from page nine in the 10-K - “ignores coupons and excludes items on promotion”, which disproportionately impacts the reported value proposition of the supermarkets (my sense is that grocery store pricing more heavily relies on “buy one, get one” type deals versus warehouse clubs, a fact that isn’t lost on discerning shoppers). For that reason, I don’t think that the >25% data point is a completely fair representation of the (realized) gap.
With that said, I still think that warehouse clubs, generally speaking, benefit from something closer to an “everyday low price” / EDLP pricing model, which will continue to be a point of competitive differentiation versus traditional grocers. (“We have taken and expect to continue to take share from grocery.”)
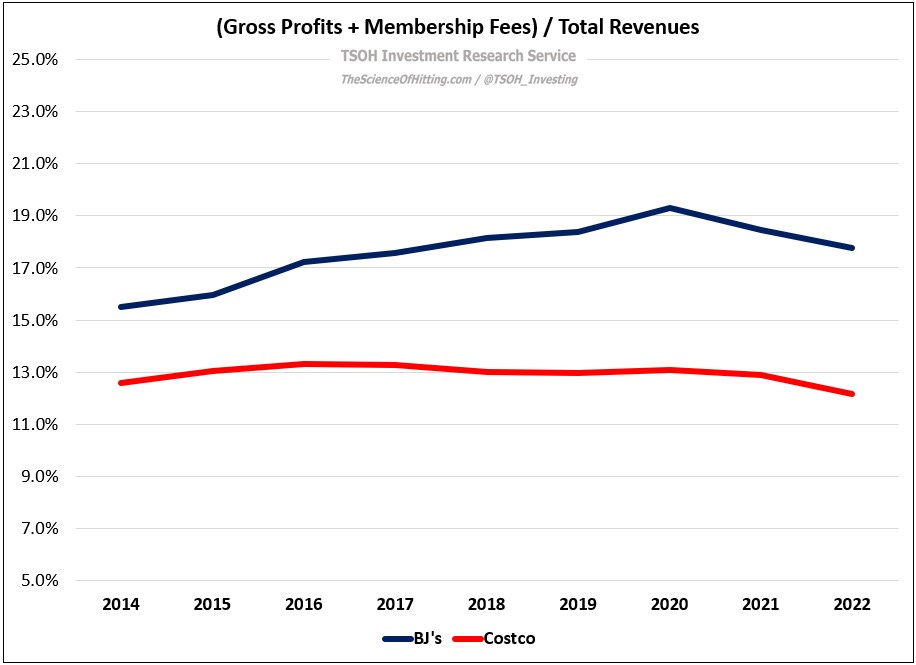
Here’s another way to frame BJ’s pricing. The following chart compares BJ’s and Costco’s gross profit margins (the calculation is gross profits plus membership fees as percentage of total revenues). As you can see, BJ’s margin level in 2022 was nearly 600 basis points higher than Costco’s result. Given BJ’s outsized exposure to (if anything, lower gross margin) Consumables / Food & Beverage, along with the strong likelihood of greater efficiency with Costco’s operating model (higher AUV’s and better supplier negotiating leverage), this suggests that BJ’s all-in pricing is somewhat higher, on average, than Costco’s. As we look to the years ahead, I think an encouraging sign for BJ’s owners would be if the company tightened the gap with Costco, i.e. reported lower gross margins. (From BJ’s Q3 FY23 call: “Our pricing index against our grocery competitors improved by roughly 100 basis points in Q3 FY23 when compared against a year ago. We continue to deliver best-in-market pricing… Our focus on value will not change.”)
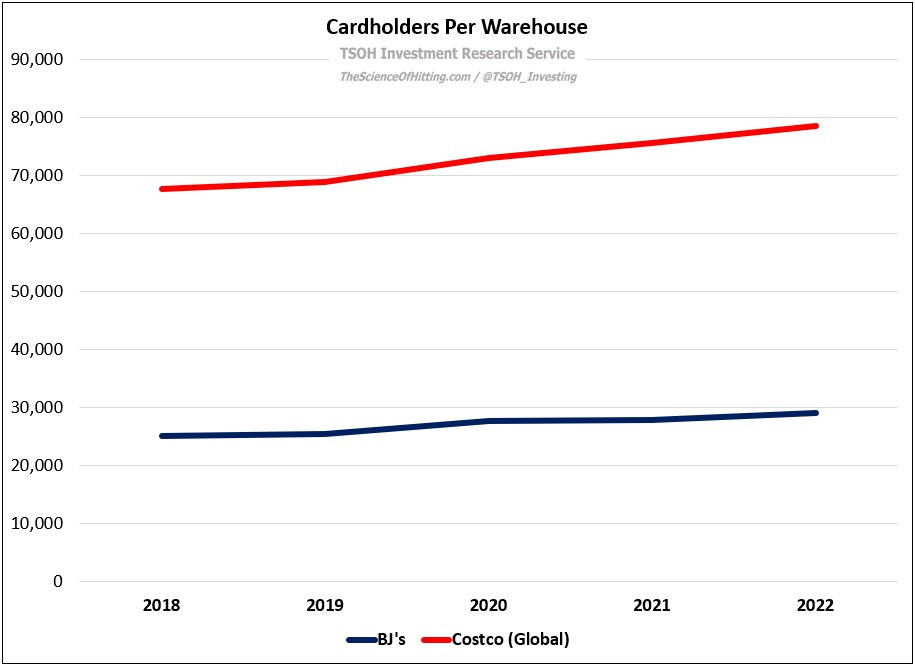
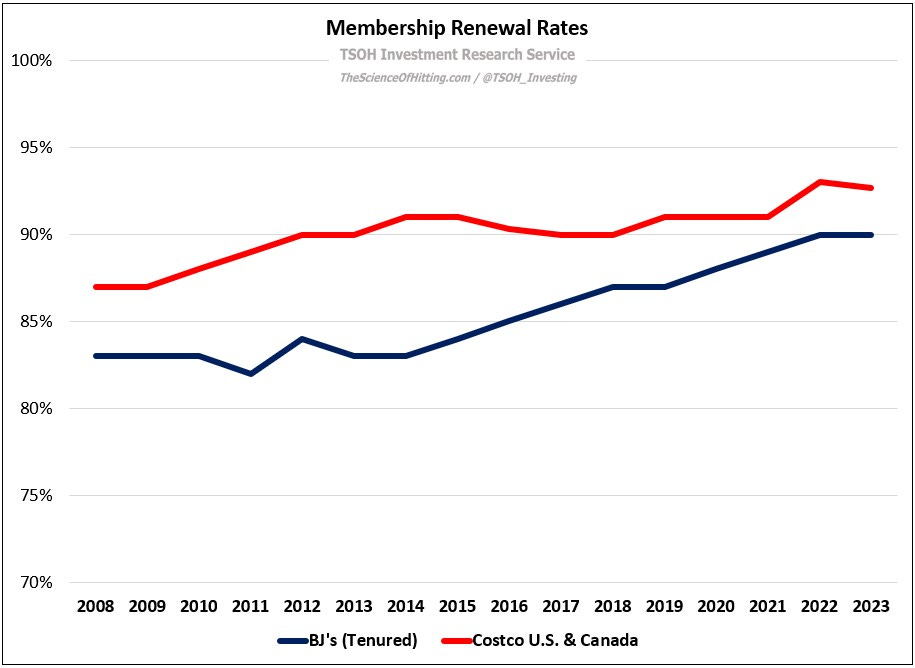
In summary, I think BJ’s can be thought of as something akin to a typical warehouse club model, but with outsized exposure to grocery (less GM); like Costco and Sam’s Club, it ranks favorably on pricing / value relative to most supermarkets, particularly when those grocers are judged on everyday (non-promotional) prices. That said, BJ’s historic financial data, along with certain KPI’s like revenues per warehouse, paid cardholders per warehouse, and customer renewal rates, all suggest they fall short of their best-in-class peer.
On that last metric (customer renewal rates), it’s important to note that BJ’s only reports a tenured membership renewal metric. That term isn’t clearly defined in the 10-K, but the S-1 explains that it only accounts for members who have been a cardholder for two or more years. Said differently, BJ’s renewal rates lag Costco’s, despite the fact that BJ’s measure excludes its newest customers - the one’s who are most likely to churn, and by a wide margin: as Costco noted during a May 2022 conference, the renewal rate for year one members at that time was roughly 70%. Frankly, I find it astounding that BJ’s management believes this is an appropriate way to report this KPI. (For what it’s worth, I also reached out to IR at Costco; they confirmed that their renewal rate calculation is inclusive of all members.)


