Airbnb: A Travel Revolution
Following the most difficult year in the company’s history, which culminated in April 2020 with the firing of one-third of its employees and a $2 billion capital raise at what proved to be punitive terms (“the equity portion valued Airbnb at $18 billion”), 2021 has provided a much needed reprieve for Airbnb.
In Q3, nights & experiences (N&E) booked on Airbnb increased 29% YoY, to 79.7 million bookings (with a gross booking value, or GBV, of $11.9 billion). Against the comparable period in 2019 - a more meaningful comparison than the heart of the pandemic - N&E declined 7%, with GBV increasing 23% (the gap between N&E and GBV reflects higher average daily rates, or ADR’s, which were +33% versus Q3 FY19). The Q3 N&E decline reflects continued pressure in Asia Pacific (negatively impacted by a lack of cross-border travel), offset by growth in North America and LatAm (both up double digits vs FY19).
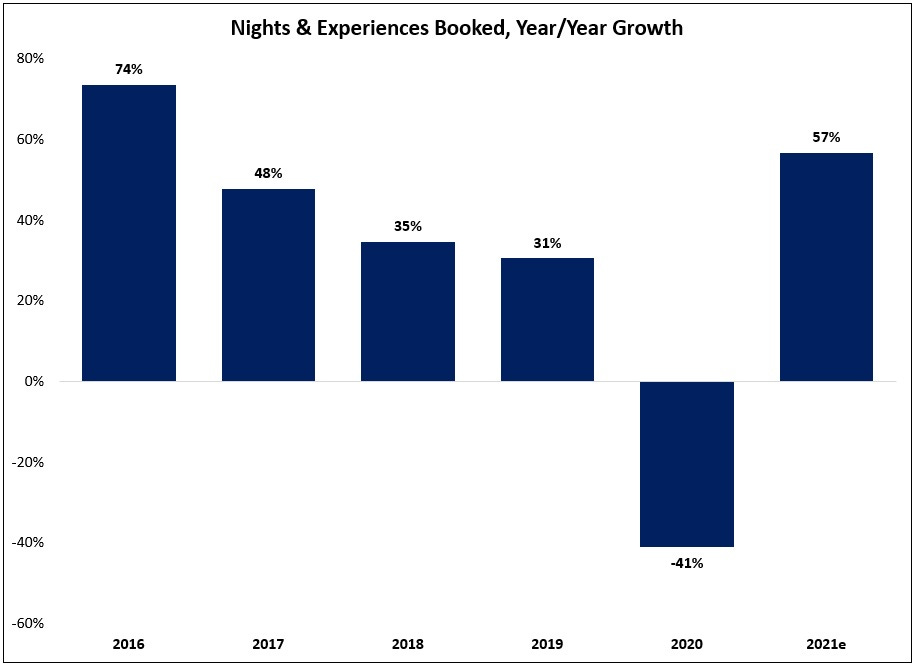
Following a 41% decline in 2020, the company’s Q4 guidance implies that overall N&E bookings will increase by nearly 60% in 2021 (+55% YTD).
The business hasn’t completed returned to 2019 levels, but it has outpaced industry peers to date: at Booking Holdings, the world’s largest online travel agency (OTA), Q3 FY21 room nights booked were -18% versus Q3 FY19.
This outcome is partly reflective of the inherent adaptability of Airbnb’s business model: the decentralized nature of its platform enables hosts to quickly adjust their listing to meet guests’ evolving needs. A notable example is long-term stays, which remain in high demand given the flexibility afforded by remote work: in Q3 FY21, long-term stays (28 days or more) accounted for 20% of nights booked, up from 14% in Q3 FY19 (the vast majority of active listings now accept long-term stays). As CFO David Stephenson noted on the call, long-term stays are a massive opportunity: “We think this adds hundreds of billions of dollars to our TAM”.
This same idea also applies to where people travel: with heightened demand from guests for travel outside of densely populated areas like Paris or New York City, Airbnb has seen a corresponding increase in host supply (“active listings in non-urban Europe and North America increased almost 15% from Q1 2021 to Q3 2021”). As a result, bookings within the top ten cities on the platform accounted for just 6% of gross revenues in Q3, 50% lower than the bookings mix attributable to the top ten cities on Airbnb throughout 2019.
Guest satisfaction is important for stimulating demand, but it also requires a corresponding increase in supply (through new hosts or a willingness among current hosts to add additional dates of availability on their calendar; as CEO Brian Cheksy noted on the Q3 call, “the vast majority of Hosts only rent occasionally”). Importantly, as noted in the shareholder letter, the number of active listings on Airbnb has grown in each quarter in FY21 (listings in LatAm are +25% versus Q3 FY19, with listings in North America and EMEA +10%).
Airbnb’s isn’t just focused on host (supply) and guest (demand) growth; it also needs to facilitate matching hosts and guests. The company’s “I’m Flexible” search is an example of how innovation in product design can help improve marketplace liquidity (“I’m Flexible allows us to point guest demand to where and when we have ample Host supply - increasing demand for our existing Host community, without the need to add listings.”) Since it was introduced in May 2021, “I’m Flexible” has been used 500 million times (“on more than 40% of searches, guests are flexible on where or when they’re traveling”). This month, Airbnb will roll-out enhanced “I’m Flexible” features, including expanded date ranges (search for accommodations up to 12 months out) along with additional category filters. This is just one example of how Airbnb continues to improve its value proposition for guests and hosts alike, while further differentiating itself from competitors (by highlighting the depth and uniqueness of its supply).
In Q3 FY21, Airbnb generated $1.1 billion of adjusted EBITDA – the highest quarterly print in the company’s history, and a more than 3x increase compared to Q3 FY19 ($314 million). This outcome reflects a combination of fixed cost leverage from continued revenue growth, as well as much lower operating expenses (“reduced variable costs, lower marketing expense, and fixed cost management”). As noted in my Airbnb deep dive, I believe the organization did not place much emphasis on cost efficiency prior to the pandemic (as Chesky noted on the Q4 2020 call, “that crisis made us much better because the first thing that happened is we got more disciplined... it was a crucible moment for the company”); the difficulties faced during the heart of the pandemic provided the impetus for meaningful change within the organization, along with the experience to recognize that this business is much less dependent on performance advertising than traditional OTA’s (through the first nine months of FY21, Airbnb’s brand and performance marketing spend was equal to 11% of revenues - more than 2,000 basis points lower than BKNG’s marketing spend as a percentage of revenues).


